Download the app on Google Play
Installing the App
SailViewer is primarily designed for Android tablets, but it also works on Android phones. The experience is less comfortable on phones because of the smaller screen. The app can also be used on Mac and Windows through an Android emulator.
Android
To install the app on Android, download it from Google Play: https://play.google.com/store/apps/details?id=com.ibsailing.trusailviewer
The app is optimized for tablets, but it can still be used on phones if needed.
Windows
The app can be used on Windows through Android emulator software. The full installation guide is here: https://ib-sailing.com/?page_id=30. This option uses the third-party BlueStacks emulator for Windows.
Another option is to install the emulator through Android Studio. For that setup, you can follow the Mac installation guide.
Mac
There are several ways to install the app on Mac. The full guide is here: How to Install on Mac.
Trial and Subscription
Free Usage
The app includes a free version with some limitations. You can open up to two logs at once, and most advanced features remain locked. Even so, you can still replay logs reliably, inspect them closely, and test the app using the preinstalled sample files. Sample files are always unlocked and can be used with the full feature set.
Trial Period
All users can start with a free two-month trial before deciding whether to subscribe.
Subscription
A subscription unlocks unlimited use on one installed device. There is no limit on the number of logs, and the device can be shared when needed. For example, a club, sailing team, or federation can keep one tablet available for coaches and sailors to use.
Unlocking Trial/Subscription
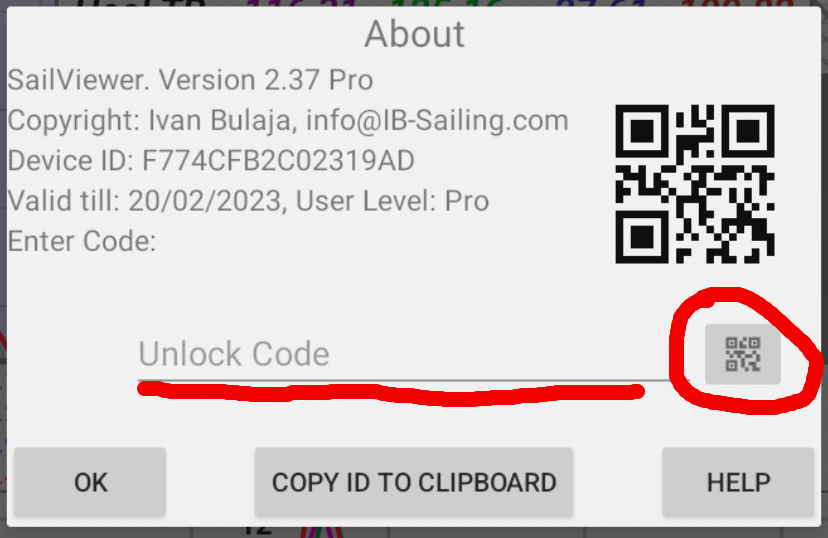
To unlock the app, send the Device ID from the app’s Menu > About screen. You can send a screenshot, a photo, or just the Device ID as text. Email it to [email protected].
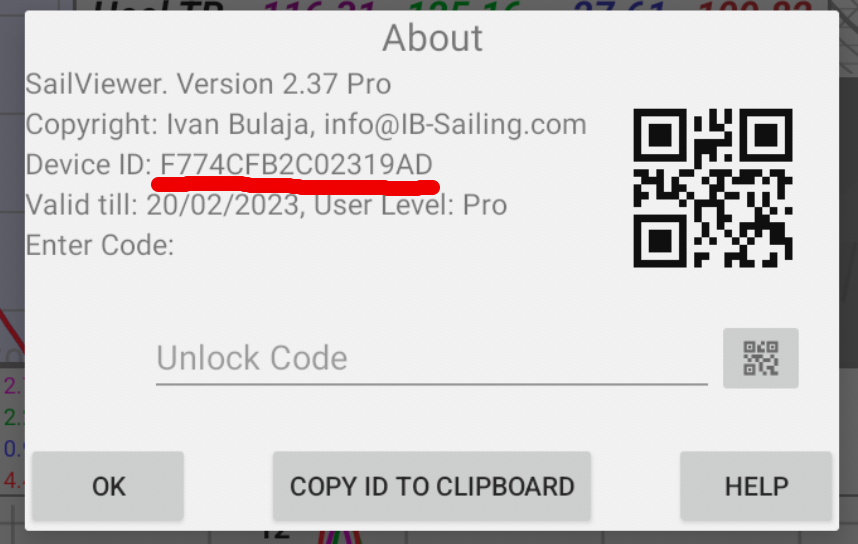
Once you send the Device ID, you will receive an unlock code that you can type in manually. For faster activation, you will also receive a QR code that you can scan using the QR button in the About dialog.
Importing Files
Importing Logs
Sharing From the Other Apps Video Tutorial
Use the “Import” button in the bottom-right corner to open the file browser and choose any supported files stored on the device.
Supported File Types
SailViewer accepts log files from all major hardware brands. See the detailed list of supported file types here. If you have a file that cannot be opened, please let us know.
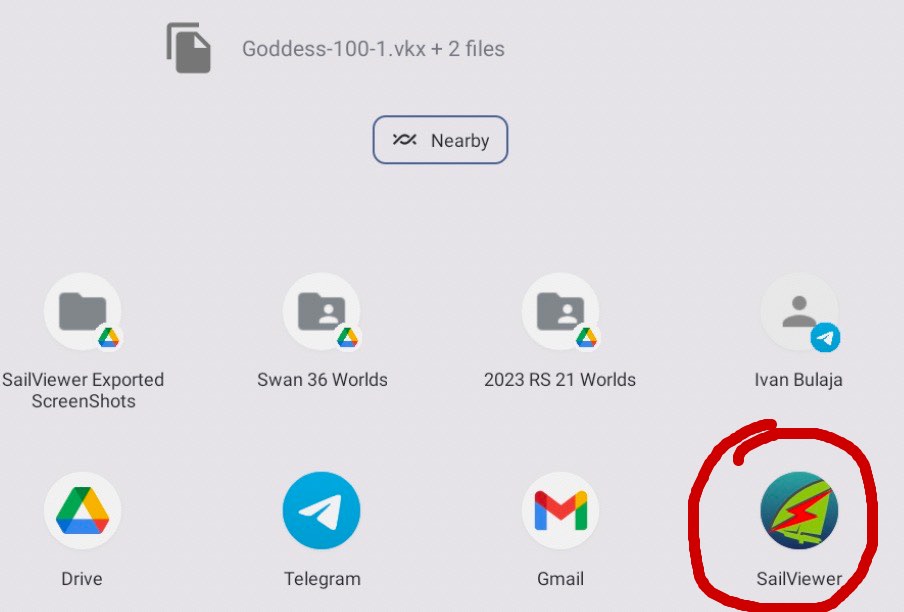
Sharing From the Other Apps
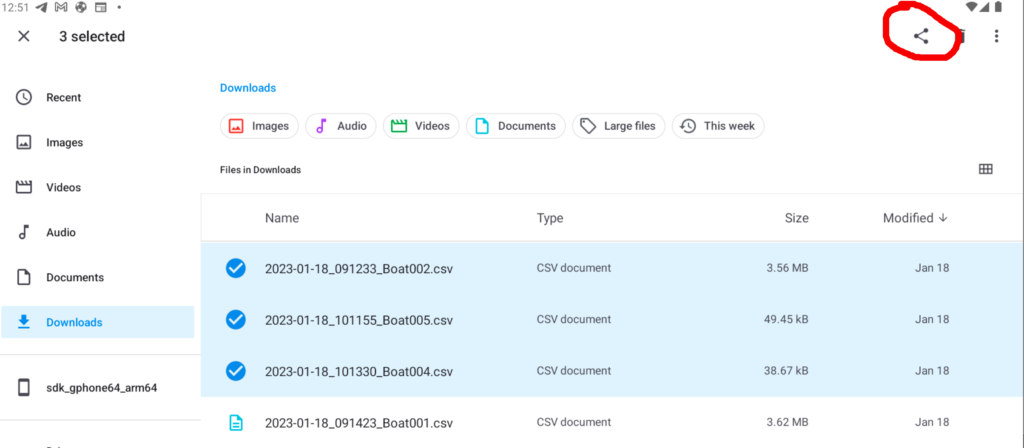
Logs can also be imported through the “Share” or “Open With” option in other Android apps such as File Browser, Gmail, WhatsApp, or Telegram. Select the files, tap “Share”, and choose SailViewer from the suggested apps.
Android Smartphone Sail Logging App
The same developer also created a simple smartphone logging app for Android that records GPS data, pitch, and heel. It works well with waterproof phones. The app includes a “Share” button, so files can be sent by email, WhatsApp, Telegram, and similar tools. Telegram is especially useful for sending files to yourself across multiple devices. Once the phone is set up and zeroed, it can log for many hours, and charging by power bank is possible without removing it from the boat.
The app is called “Sail Logger” and is available free on Google Play and the App Store. Get it here:
You can learn more about Sail Logger here: Sail Logger App.
Navigating the Logs
Watch the Navigating Logs video tutorial

Sliders
Watch the wind setup video tutorial
The “Wind slider” changes the wind direction. The – and + buttons adjust it by 1 degree.
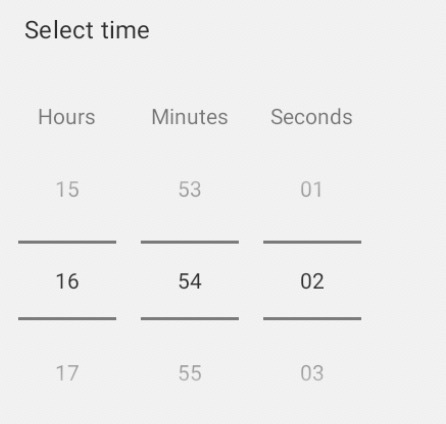
The “Time slider” sets the time window. Tapping the menu buttons on either side opens options for fine-tuning with +1 second and -1 second buttons or entering a custom time.
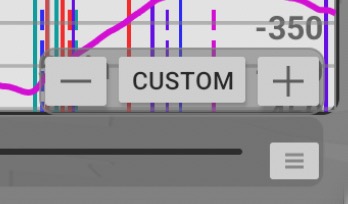
Zoom Buttons

The “Zoom +” button moves the sliders toward the edges so you can fine-tune the selection more easily. Use it whenever the sliders are too close together.
The “Zoom -“ button zooms back out. The final step returns to the full log view.
Move to the Point On the Graph Screen
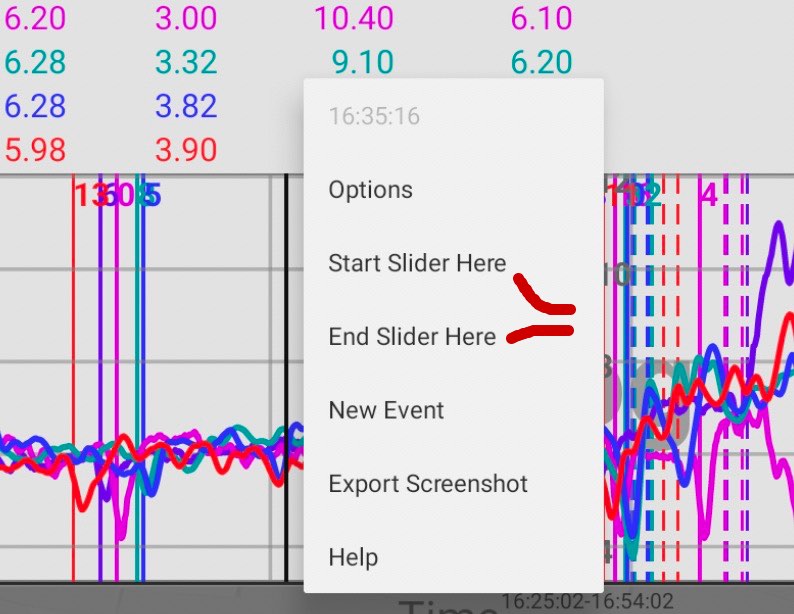
You can move either slider to any selected point on the “Graph Screen”. Long-press the graph where you want the slider to move. A black line and menu will appear. Select “Start Slider Here” or “End Slider Here”, and the chosen slider will move to that point.
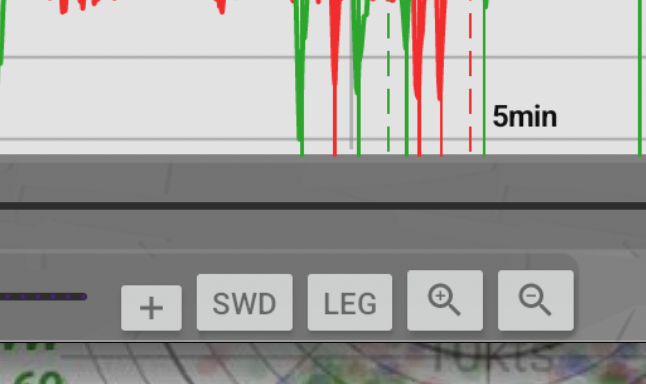
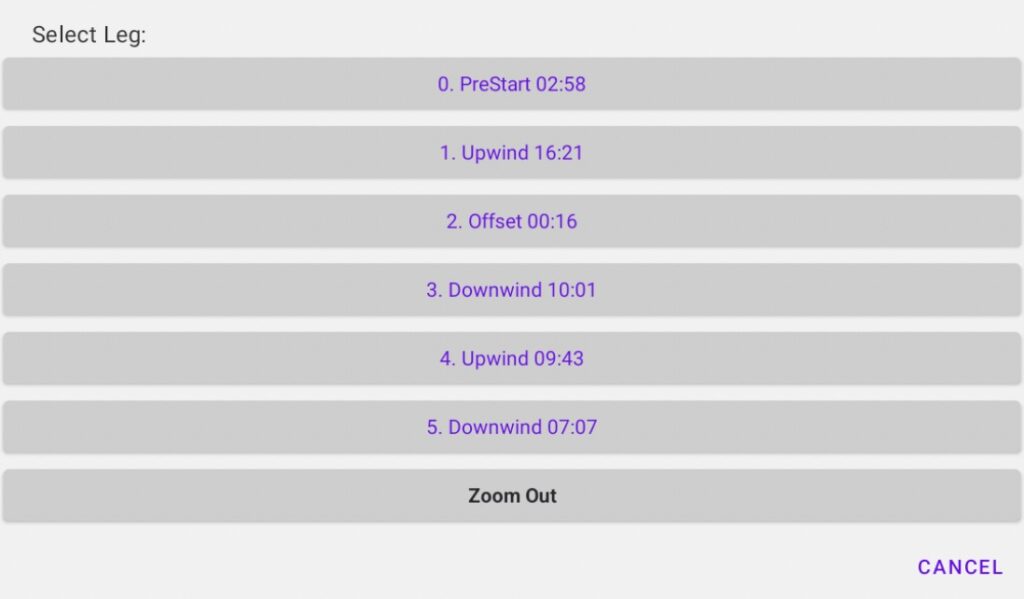
Leg Button
The “Leg” button selects and shows a single leg for all boats, or zooms back out to the full log. For this to work properly, it is best to cut the logs so their legs match. If you press “Save” while a single leg is selected, only that leg will be saved.
Cutting Logs
Watch the Logs Cutting video tutorial
Saving Selection

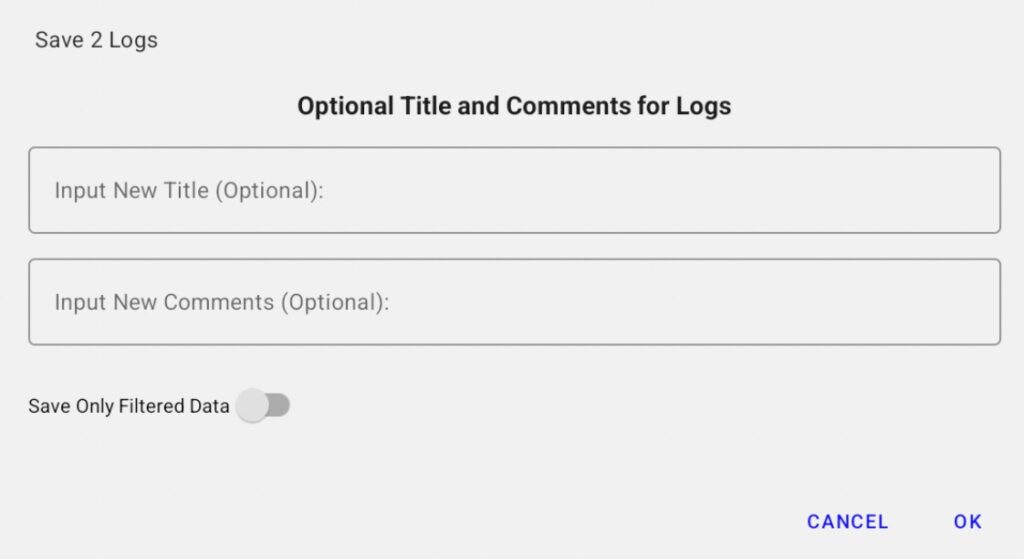
Pressing the “Save” button, or using Menu > Log > Save Logs, saves the currently selected time range for all open logs. The wind direction is also saved so it is restored automatically when the saved log is opened later.
After you tap save, the app asks for a new title and/or comments for the saved logs. If you leave those fields blank, the original values will be copied.
If filters are active, you can save only the currently filtered points by selecting “Save Only Filtered Data”.
Cutting Races
The app can also cut and save windward/leeward races based on the selected start time and finish line. For more details, click here.
Mobile Phone Usage
On mobile phones and other small-screen devices, sliders and buttons remain hidden until you tap the background of the app. Many dialogs become scrollable to fit the smaller screen. The app is not optimized for phones, but it can still be used for testing or light review. Hiding the “Files” screen gives you more working space.
Screens
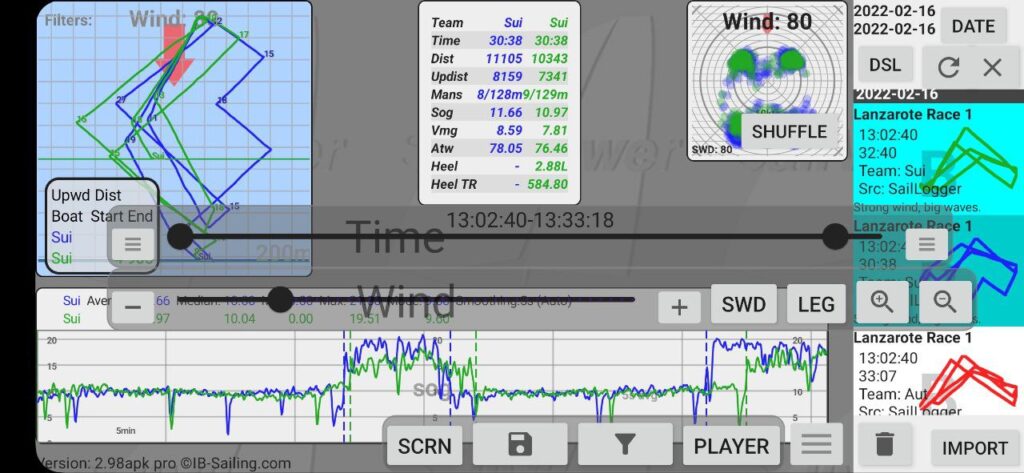
All screens in the app can be resized or closed. Use the “+” and “-“ buttons, or pinch to zoom, to resize them. Use the “X” button to hide a screen. Screens can also be shown or hidden with the “SCRN” button once logs are open, or through Menu > Screen.
Files Screen
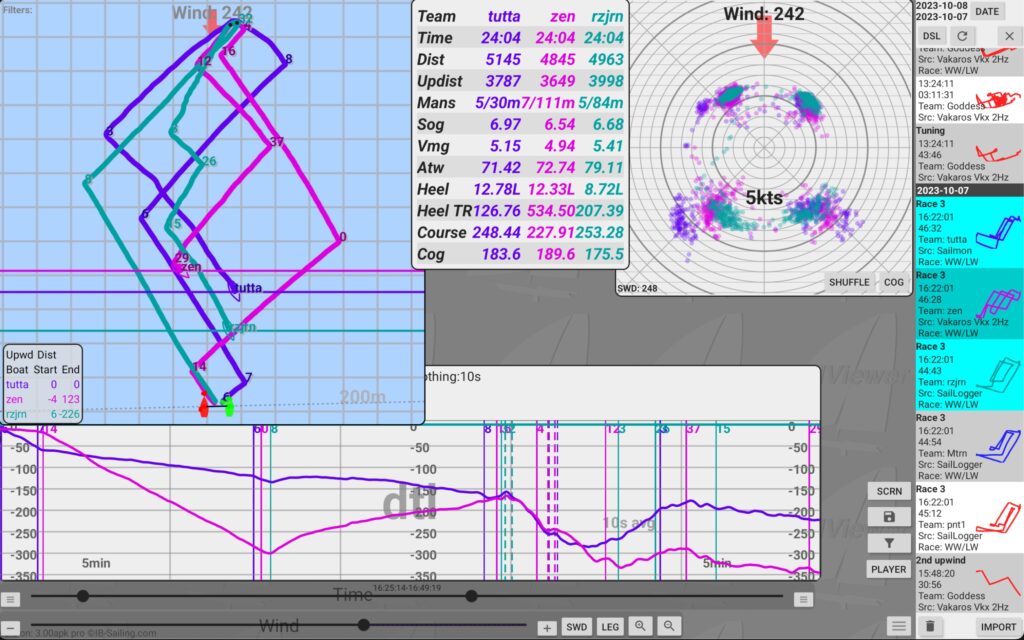
The Files Screen shows all logs available to the app, together with their basic information and GPS tracks.
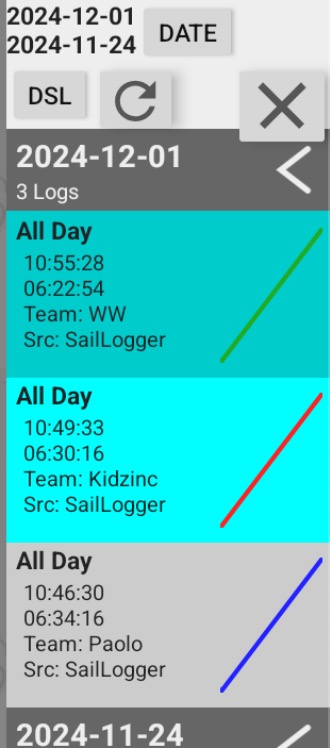
DATE scrolls directly to the selected date.
IMPORT opens the file browser so you can choose logs to import.
DSL deselects and closes all open files so you can start fresh. This is especially useful when open files are spread throughout a long list.
DELETE removes the open logs after a confirmation step.
REFRESH updates the list.
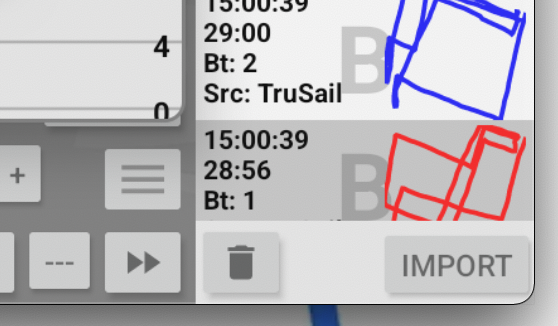
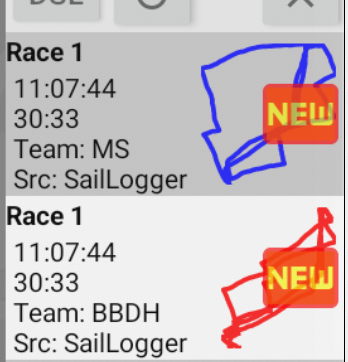
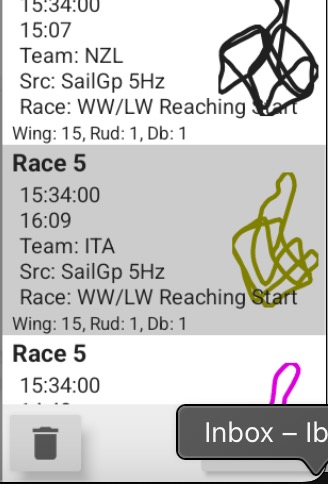
Tap a log to open or close it. Selected files turn blue.
Long-press a log to see more information and open editing options.
While you scroll through the file list, the map view shows where the currently visible logs were recorded. The date range of those visible logs is shown at the top of the Files Screen.
You can collapse or expand a single date by pressing the chevron on its right side. To expand or collapse all days, long-press the date title, the dark row above the logs for that day.
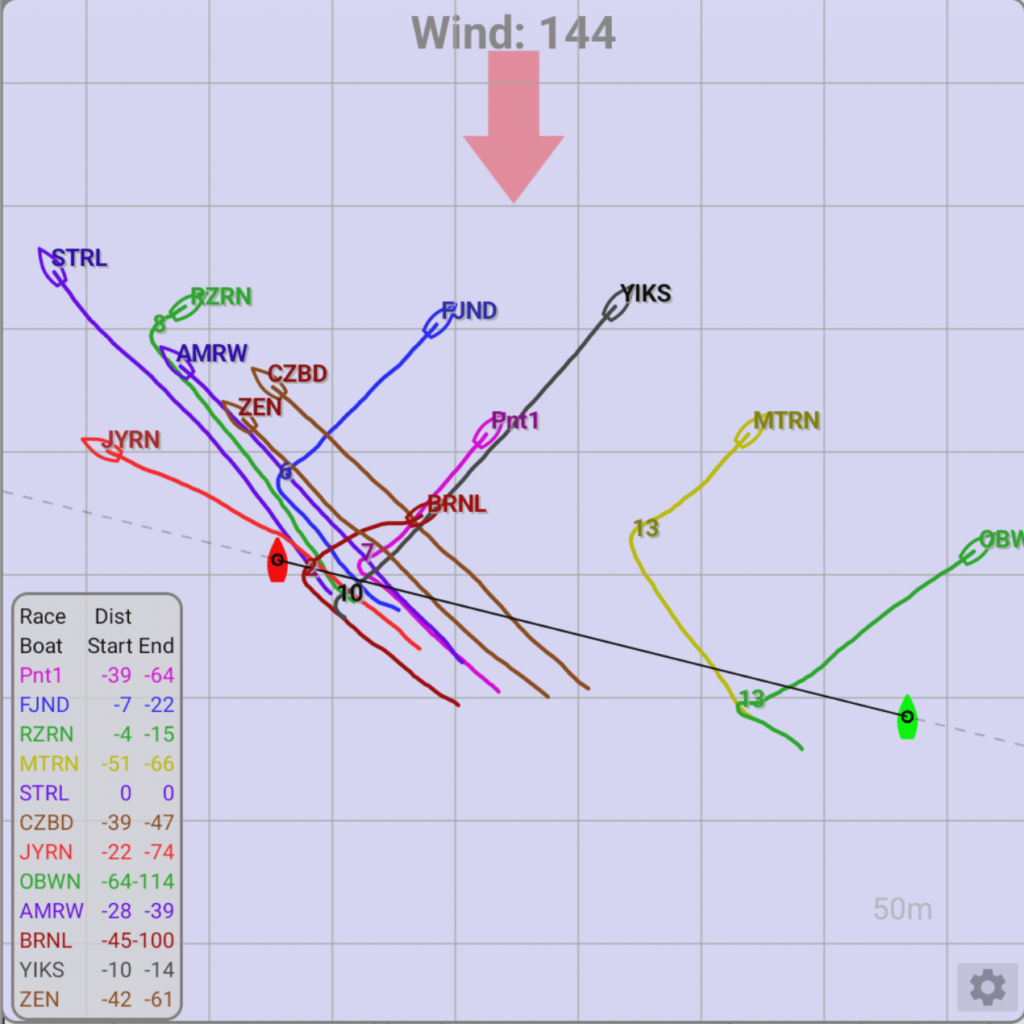
Path Screen
See more details about the Path Screen here
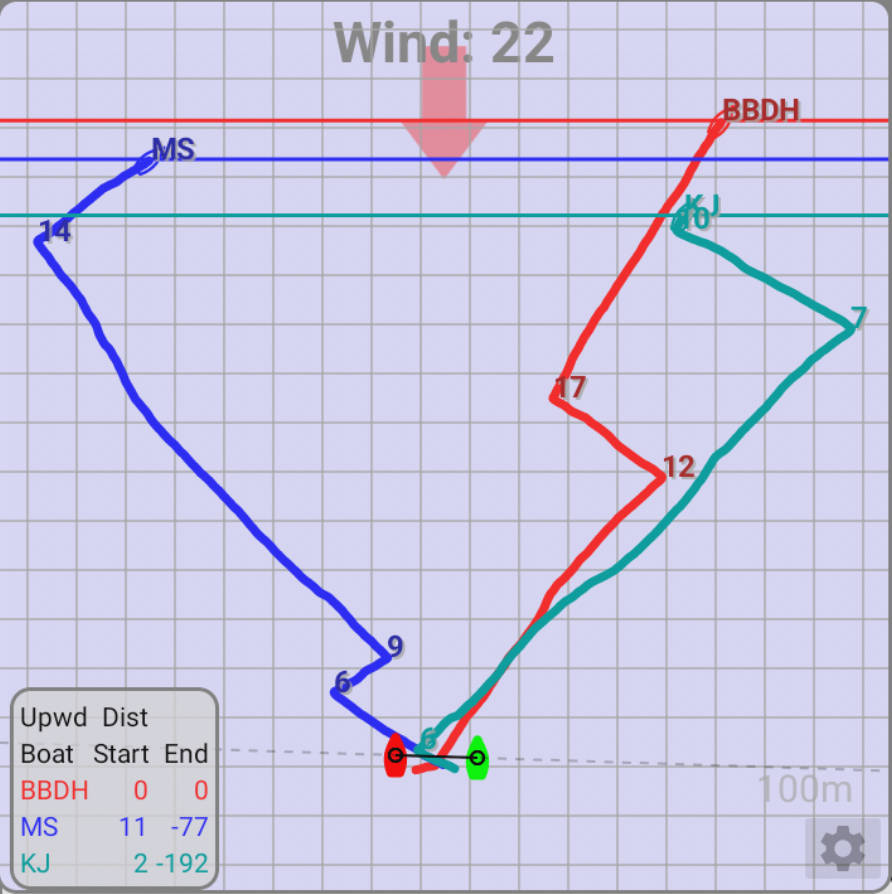
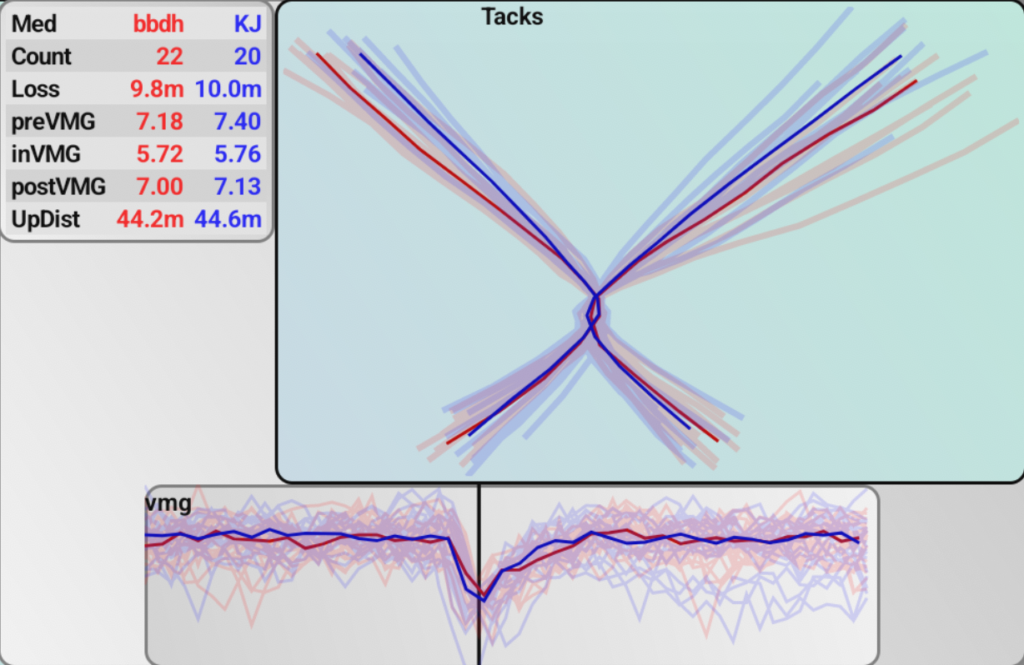
The “Path Window” shows the GPS tracks of the boats together with extra information such as maneuver losses and distances. More details are available here.
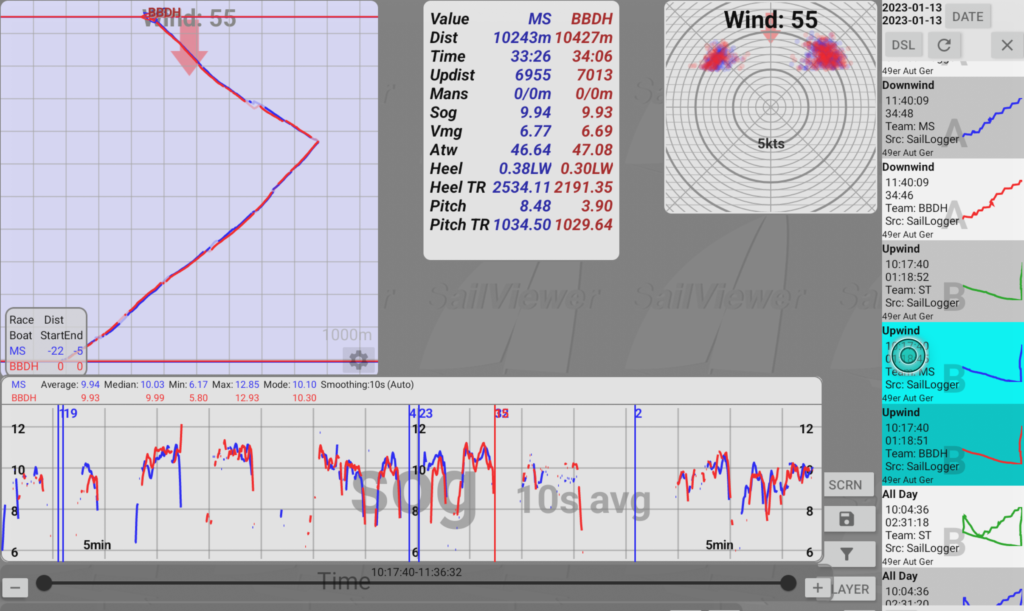
Graphs Screen
See more details about the Graphs Screen here
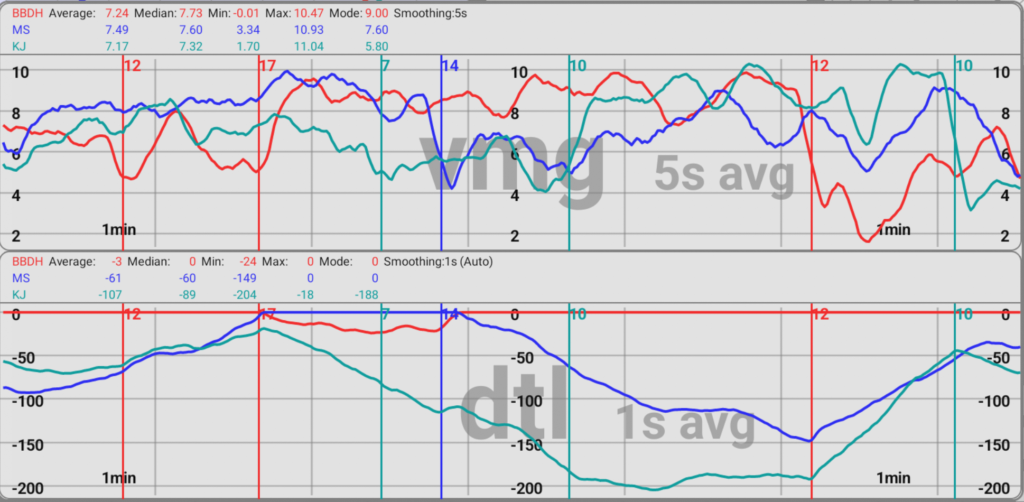
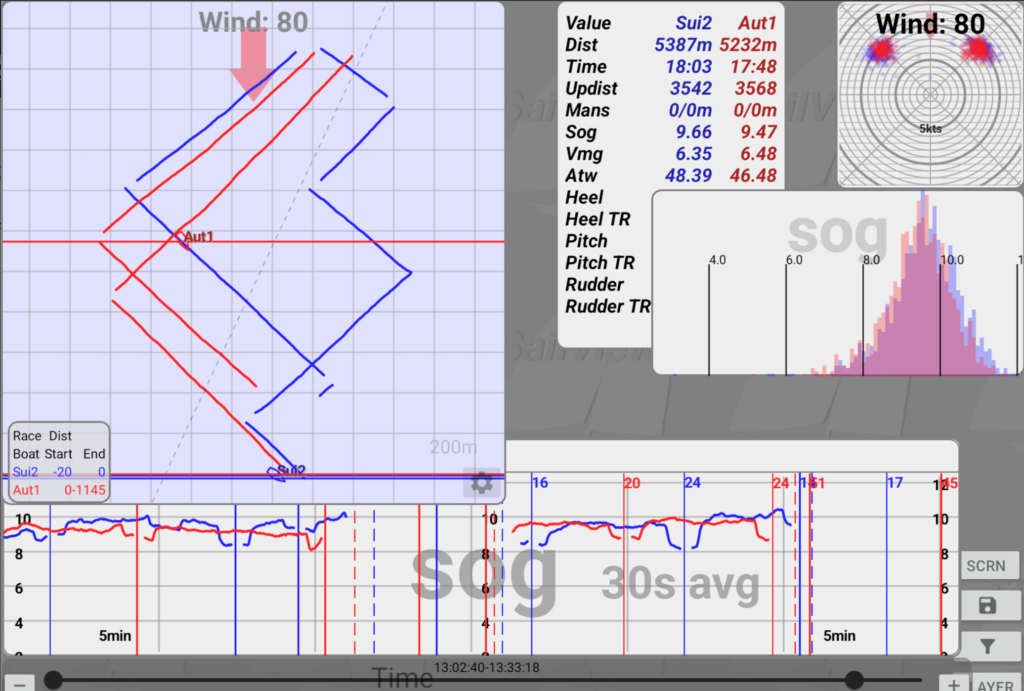
The Graphs Screen shows one or more measured or calculated values as graphs. It also includes short statistics and selected events.
Polar Screen
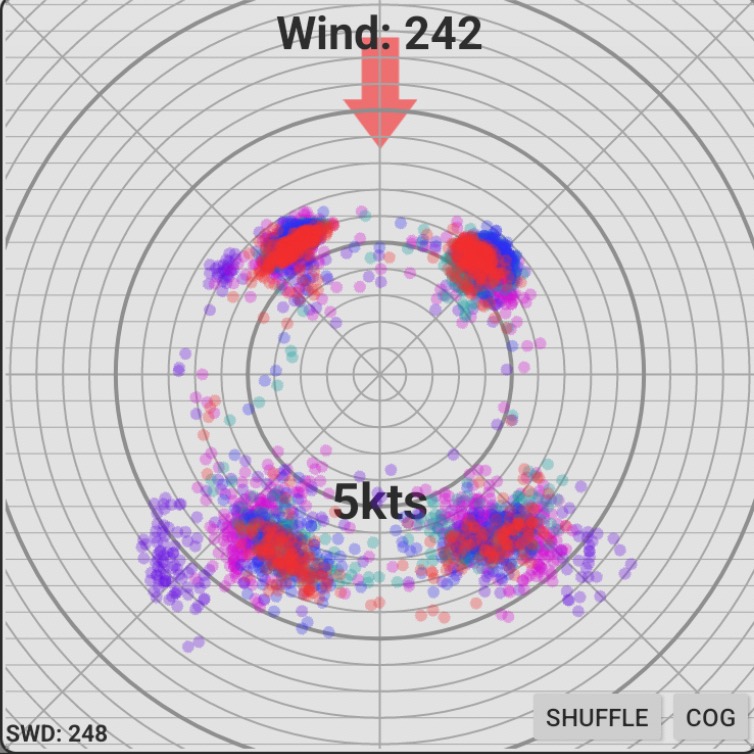
The polar diagram shows all sailing points from the selected time range. Distance from the center represents speed, and the angle represents angle to the wind. Click here for more information.
Histogram
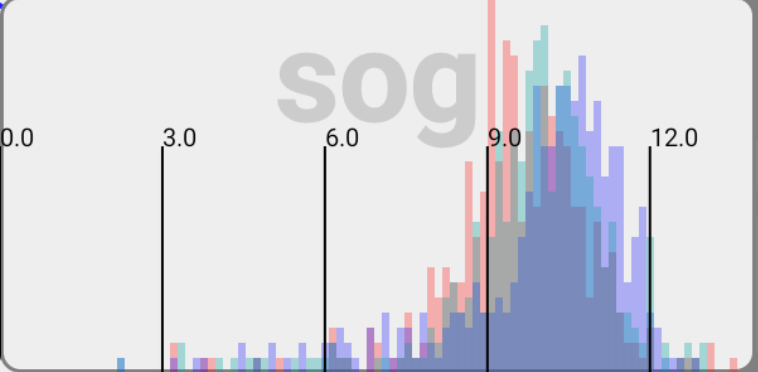
In the histogram window, you can view the distribution of the selected value. To change the displayed value, click the Value button. The button with the numerical value represents the data size percentage on the screen, where 95% indicates that 2.5% of data on each edge is excluded from the display.
Data Screen
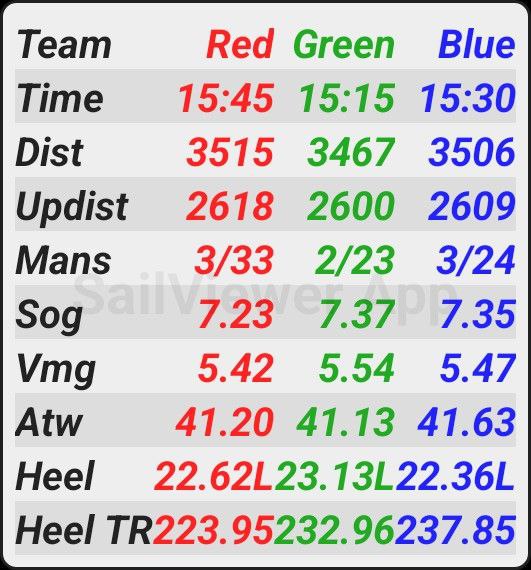
The Data Screen shows the average numbers of any selected value for the chosen time period. For more info, follow the Data Screen Guide.
BoxPlot Screen
The Box Plot window shows how a selected value is distributed over the chosen time range.
More info about it here: BoxPlot Screen Guide
At its core is a colored box, representing the middle range of the data — by default, the 25th to 75th percentiles. This means the box contains the central 50% of values.
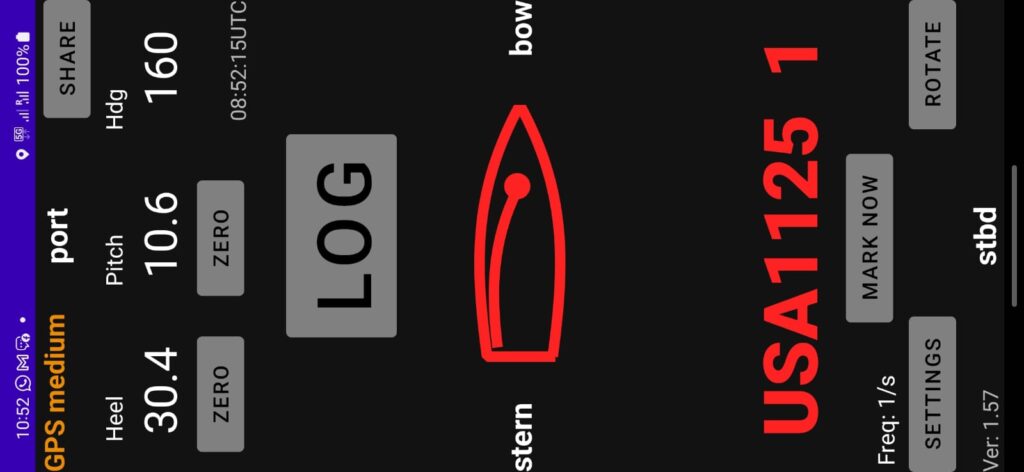
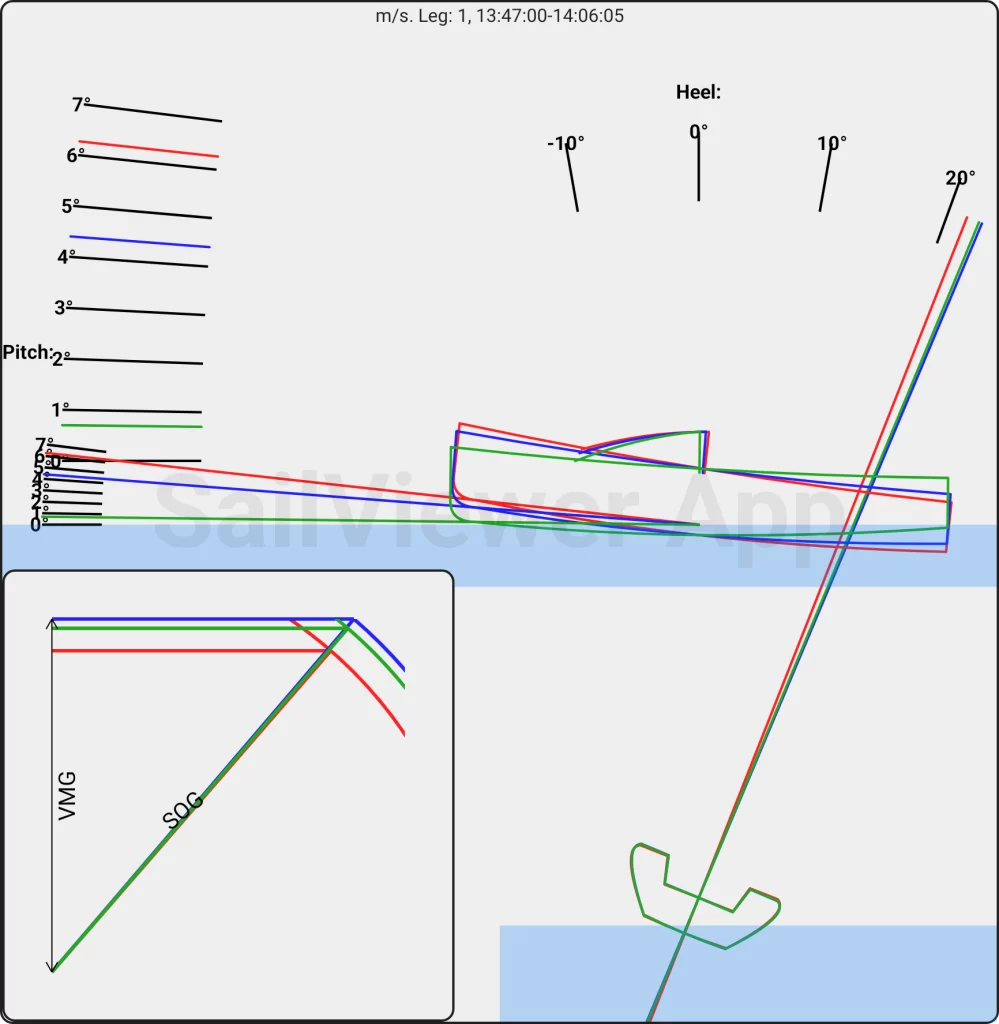
Boat Screen
The Boat Screen shows the boat’s orientation, sailing angle, and speed. The boat shape is tilted according to the average heel and pitch values. VMG and SOG show angle to the wind and speed. On upwind legs, a higher horizontal line means better VMG. The arcs represent boat speed.
Race Screen
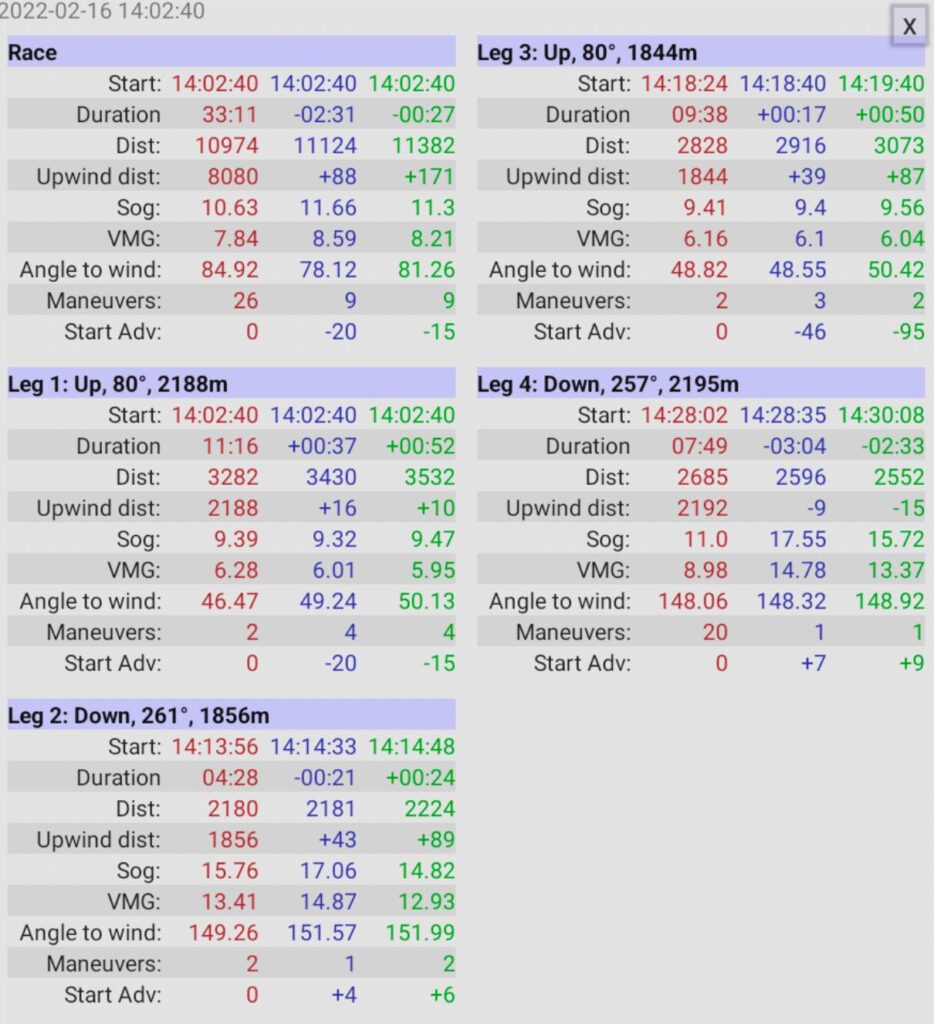
The race window shows data for the whole race. It doesn’t depend on the time selection and always uses the whole log, so it should be used on pre-cut races.
It shows different statistics for each leg and the whole race.
Map Screen
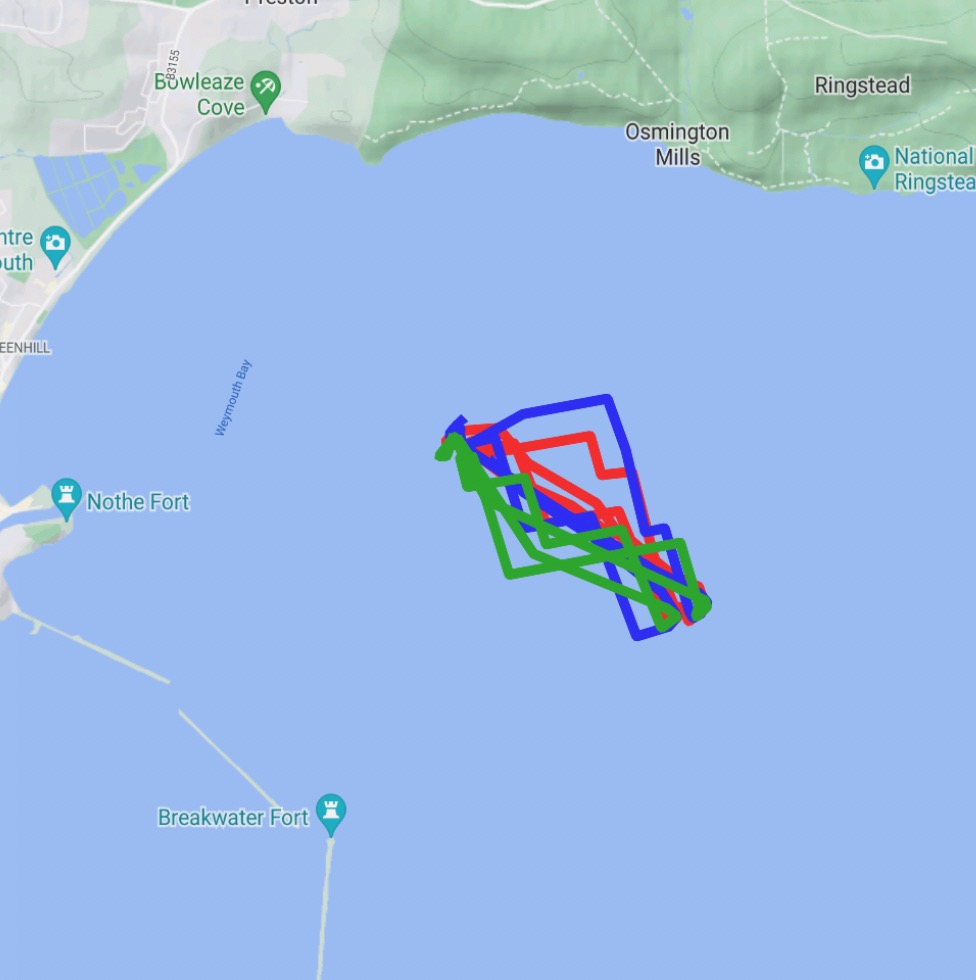
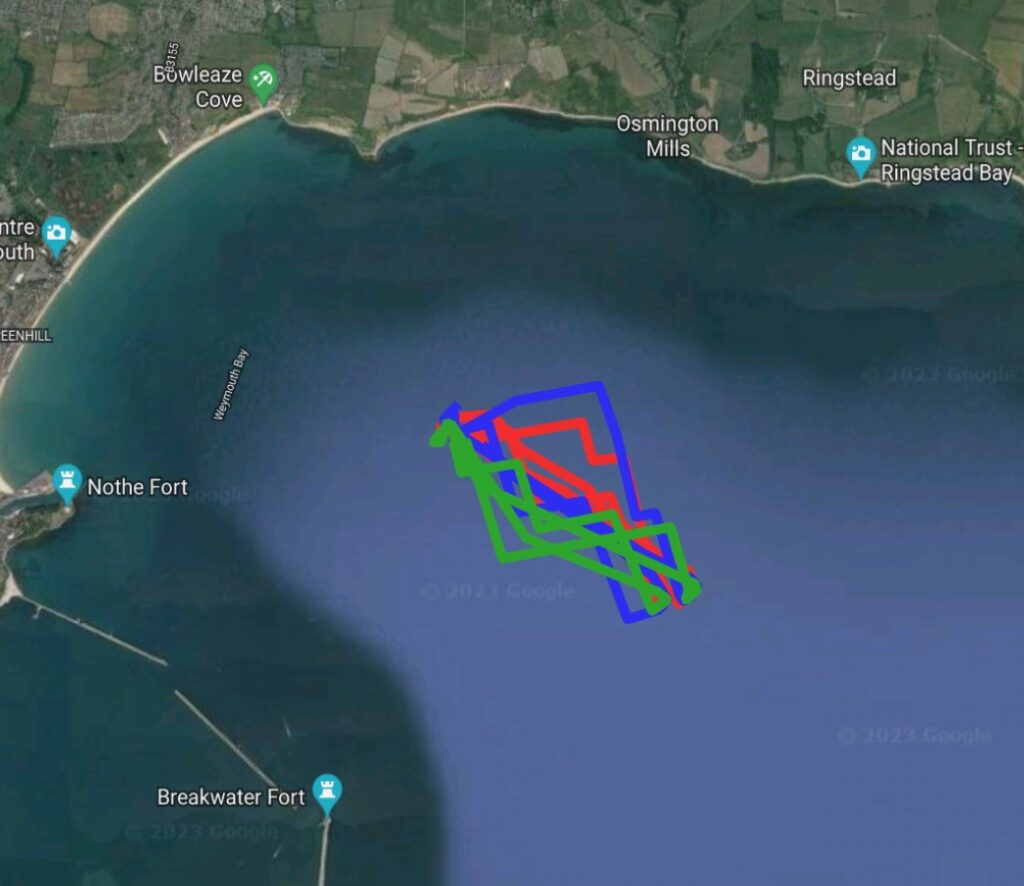
This screen shows a Google Map for the selected logs, which is useful for spotting geographical effects. Click the Type button to cycle through the different map styles.
Video Screen
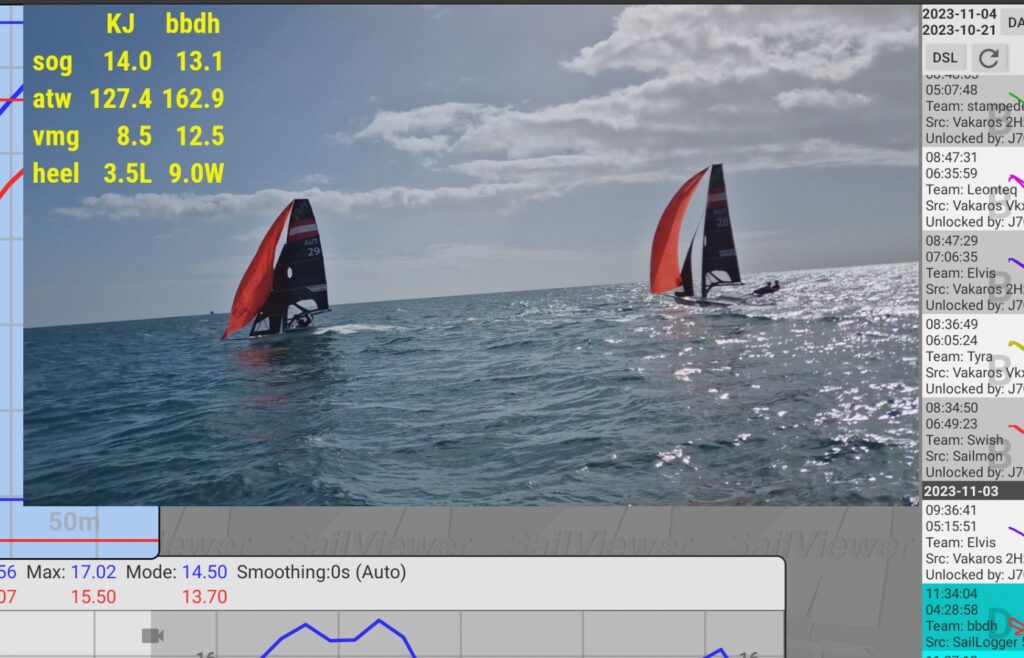
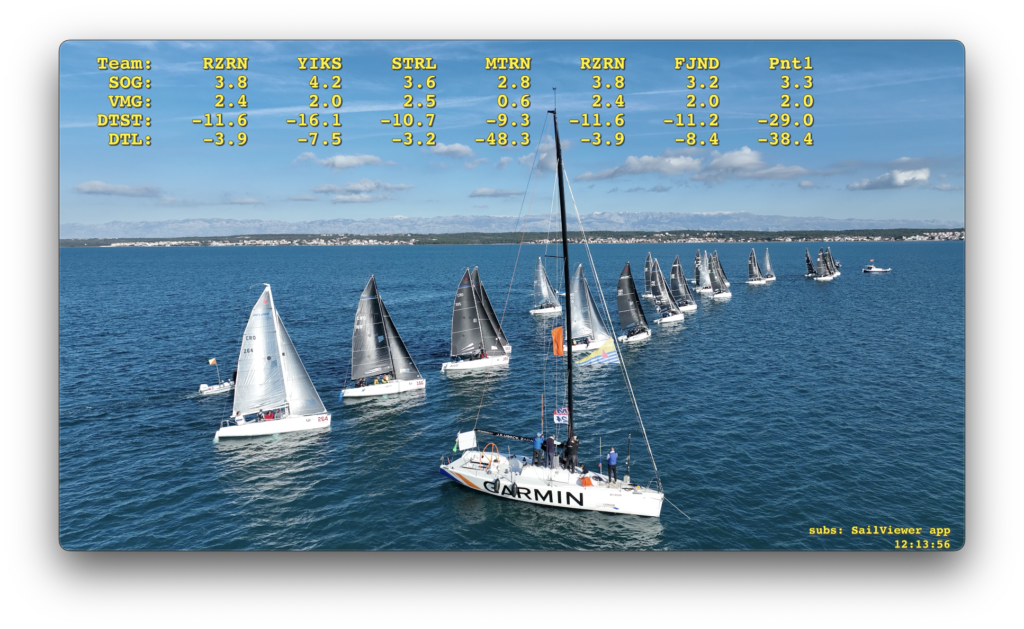
The Video Screen shows the imported videos with data overlaid on it. For more info, please follow the Video Screen Guide.
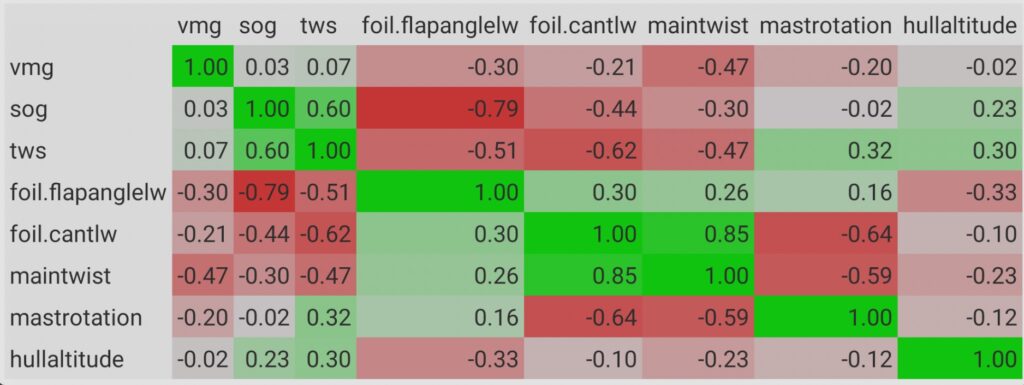
Correlation Screen
The Correlation Screen shows the correlation coefficients between any chosen values. The correlation coefficient is a numerical measure representing the strength and direction of a linear relationship between two variables; it ranges from -1 (perfect negative correlation) to 1 (perfect positive correlation), with 0 indicating no linear correlation. A positive correlation means the variables tend to increase together, while a negative correlation implies an inverse relationship, where one variable increases as the other decreases. Click the Vals Button to select the values you want to see.
Exporting Screenshots
Each screen in the app includes an option to export a screenshot. To do this:
1. Long-press anywhere on the screen to open the menu.
2. Select “Export Screenshot” from the available options.
3. The app will capture and save the screenshot to the Pictures folder on your device.
4. You can then access the screenshot from your gallery and share it as needed.
Player buttons

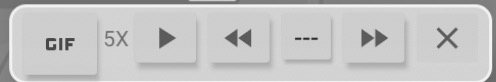
You can use the built-in player to watch the log play back. Press the “Player” button to open a small control window. Move the end slider close to the start slider, then press play. Use the “Fast forward” and “Backward” buttons to change playback speed.
The “Roll” button sets the playback time window, or expands back to the full log.
“Free” roll means the playback window matches the current selection size.
GIF creates an animated GIF of the Path Screen when you start and stop playback with the GIF button. You can then share that file.
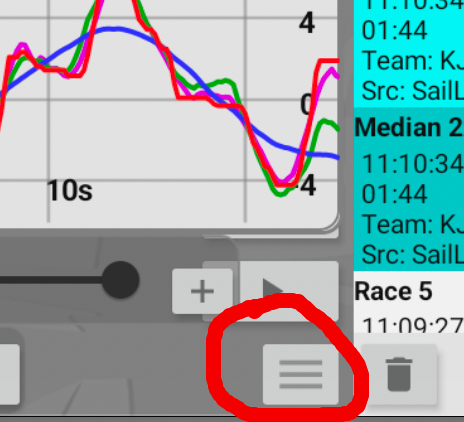
Menu Button
Import Logs
Select logs to import from the device storage into the app.
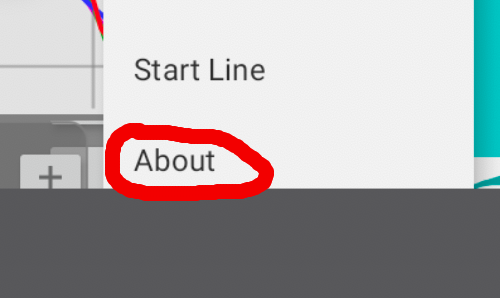
About
The About dialog is used to activate the paid app. It shows your subscription status and the device ID. Send that ID to the developer to receive your unlock code. You can also copy the ID to the clipboard and paste it into any messaging app.
You can also send a screenshot or photo of the QR code to the developer. In return, you will receive both the unlock code and a QR code. The fastest way to unlock the app is to scan that QR code using the QR button in the “About” dialog.
The About window also includes a link to this guide through the “Help” button.
Log menu
Log/Align
This aligns the start time of open logs. If you have saved the same leg for multiple boats, you can align them so they all begin that leg at the same time. It also includes an option to move the start location of all logs to the same point.
Use it to compare two logs of the same boat which were logged one after the other. It is useful to change the boat number on one of the logs and save it. Then you can see it in a different color.
Log/Merge
This merges values from one log into another by copying any missing logged values. You can swap the direction of the merge with the “Swap Logs” button.
Remember to save the new log to keep the changes.
Log/Share
This shares the selected logs. Your device will offer any installed apps that can send files, such as Mail, WhatsApp, or Telegram.
Log/Backup All Logs
Back up all the logs on the list into a .zip file. This file can be shared via different apps on the tablet.
Log/Cut race
This cuts a race for multiple boats at once. It applies the same start time and finish line position to all open logs. By default, the finish line is taken from the start point of the boat with the lowest boat number. If you want a different finish line, you can use the option to place it at the last selected point of that boat.
Race cutting guide can be found here
Log/Edit Log
After editing a log, changes remain temporary unless you use “Save and Close”. That option closes the window and saves the edited logs. You can also choose “Close” and decide later whether to save.
Title
Creates a title for the log that will be shown on the files window while browsing.
Team Name
Adds a team name to the logs.
Boat Number
Changes the boat number and the associated color.
TWS
Enter the true wind speed observed on the water, and the apparent wind values will be adjusted accordingly. AWA means apparent wind angle, and AWS means apparent wind speed.
Comments
Adds comments to the log. Part of that text is shown while browsing files.
Offset Time
Moves opened logs in time. The input time is in seconds. Use negative values to go back in time.
Simplify
If some values such as pitch or heel are recorded more often than positions, this removes the extra data points. It can help when 10 Hz logs feel slow during review.
Reduce
This reduces data-point frequency by setting a minimum time gap between points in milliseconds. Any point closer than that minimum to the previous point is removed. For example, to keep at least 5 seconds between points, enter 5000 ms.
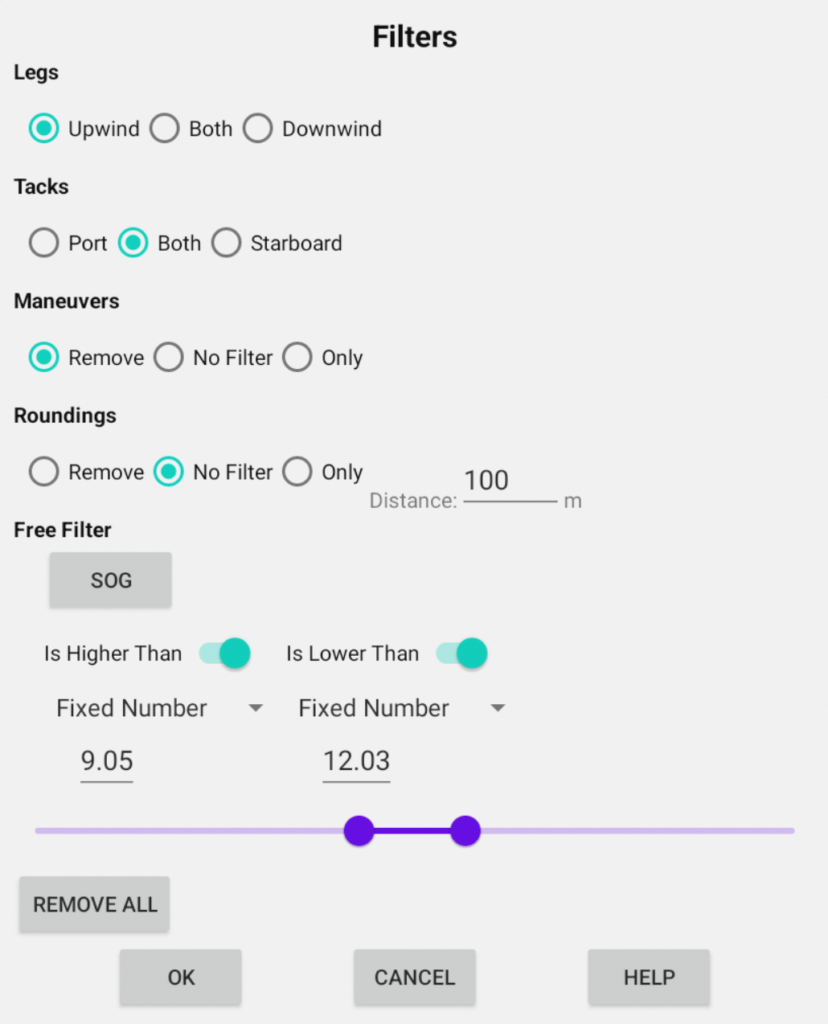
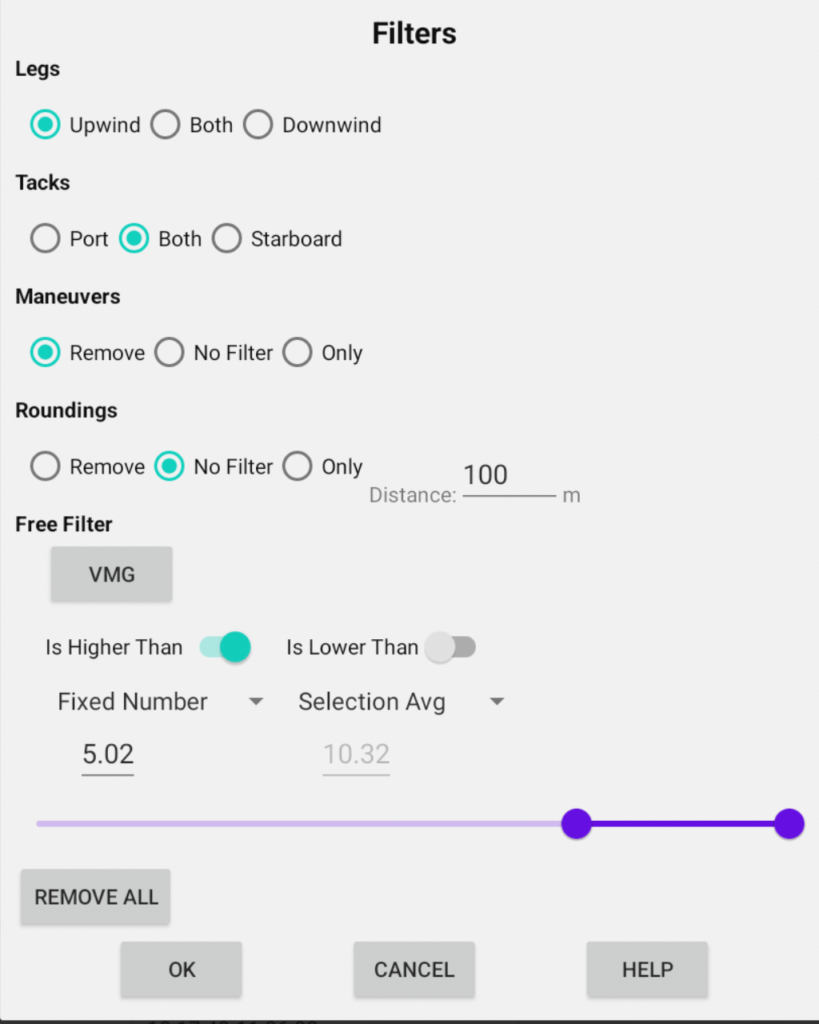
Filters
See more details about filters here
Filters enable you to choose data that meets specific criteria. All calculations and screens display only the data that meets the selected filtering criteria.
Settings
Minimum Leg Distance
Set the minimum length of the leg. If your legs are shorter than this value, make the value smaller. This is used to prevent false leg detection if the boat goes the wrong way in the leg for a while. The offset/prestart legs are not affected by this value.
Calculate Apparent Wind Values
This calculates AWA and AWS, apparent wind angle and apparent wind speed, from the true wind speed entered here.
Maneuver Timings
Maneuver Timings Settings are explained together with the Maneuver Screen.
Other options
“Calculate Pointing to Wind and Leeway” calculates the compass angle to the wind and the leeway relative to GPS course over ground. The log must contain “Heading” values. If the compass is misaligned in the boat, correct the heading through the “…/Edit Value” dialog.
Experimental Options
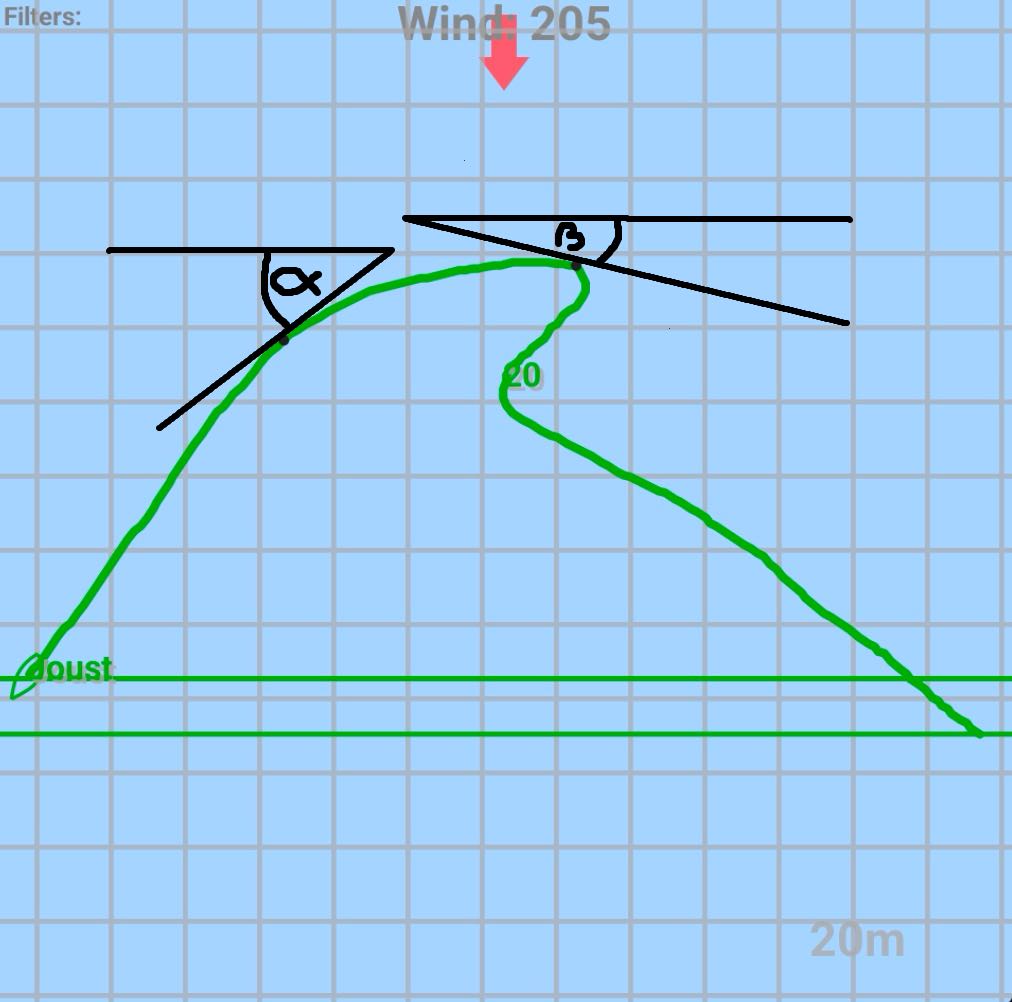
Search for the offset mark makes the app try to add the offset leg at the top mark. Two angles are defined in the drawing: Alpha for the offset-mark angle and Beta for the top-mark angle. The app finds the highest point at those angles relative to the line that is 90 degrees to the wind direction and sets them as the upwind mark and offset mark.
Edit Value
This lets you calculate travel, changes, and rate of change for any value. You can create new averaged values, offset a value if it is not calibrated correctly, add gain by multiplying it, remove the value from the log, or edit that value’s properties.
Create Average Value
You can smooth any value and save it as a new value or overwrite the original.
Smoothing time: the duration, in milliseconds, of the moving-average window.
Overwrite: replaces the original value with the smoothed one. Otherwise, the app creates a new value using the original name plus an ave or med suffix, depending on the method and averaging time. For example, a 10000 ms average of heel becomes heelave10000.
Average/Median: chooses whether smoothing uses average values or median values.
Fill Travels
Creates a new value with the travel values of the original. Travel shows how much the value changes per minute. The new value keeps the original name with the suffix travel.
Fill Rate Of Change
Creates a new value with the rate of change of the original value. For example, if used on the distance to the leader, it shows how many meters per second the boat was gaining or losing to the leader. The new value name is the original one plus the suffix change rate.
Fill Changes
Creates a new value showing the changes of how many times per minute the value is changing direction.
Minimum peak: Minimum size of the peak to consider it as a change. Any peak less than this size will not be considered.
Minimum time: Minimum time that peak is considered a change. Any change quicker than this will not be considered.
Fill Ranks
Creates a new value with the current ranking of each boat in that value. For example, the rank of DTL is the actual rank in the race. Also whenever the “higher than all logs” option is selected in filters, the app will automatically create ranks for that value.
Offset
Offsets the value by the entered amount. In other words, it adds that number to the value.
Gain
Multiplies the value by the amount entered.
Rename
Renames the value for all open logs.
Remove
Removes the value from all open logs.
Start Line
You can set a start line and display all related start-line data.
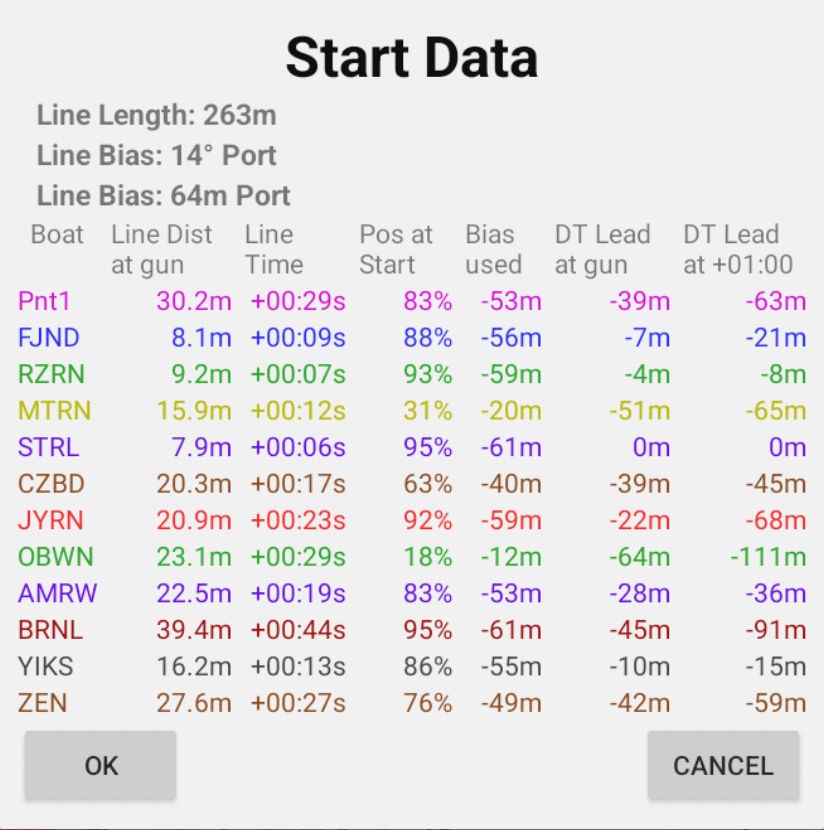
For more details, see the Start Line Guide.
Events
Start Line Events are explained in the Start Line Guide
Text Events
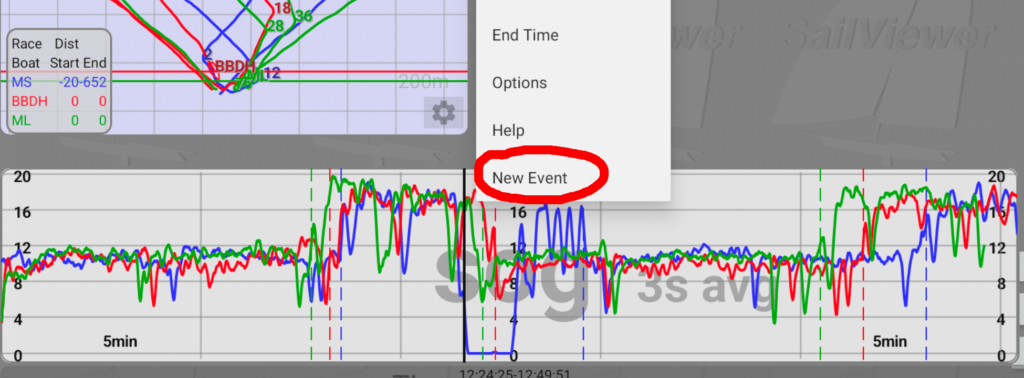
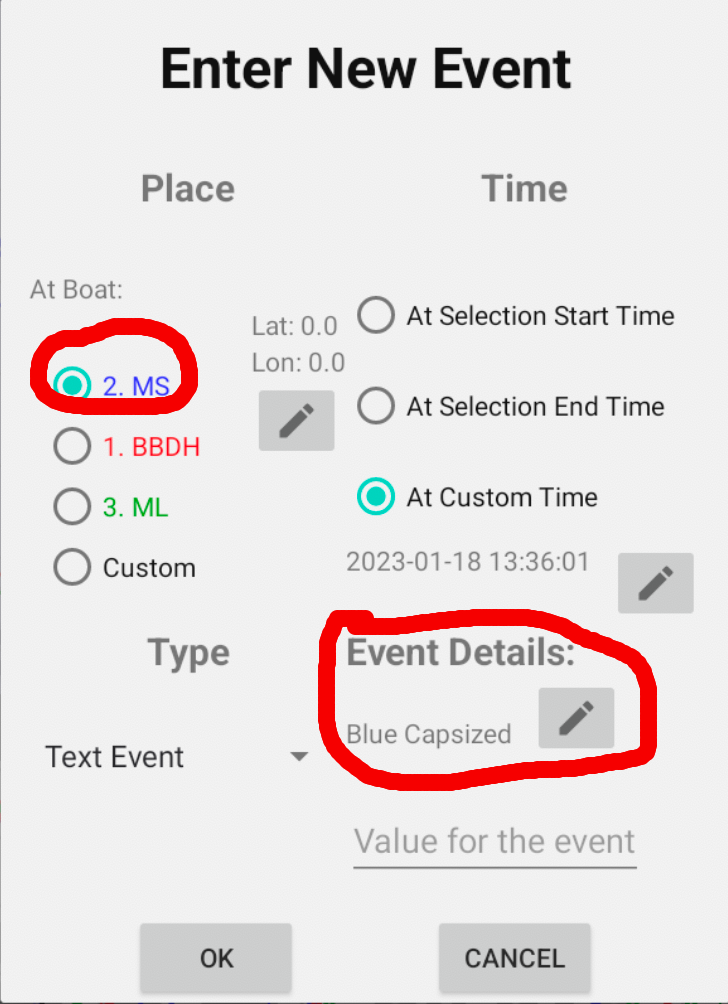
You can add a text event at any time and at any location.
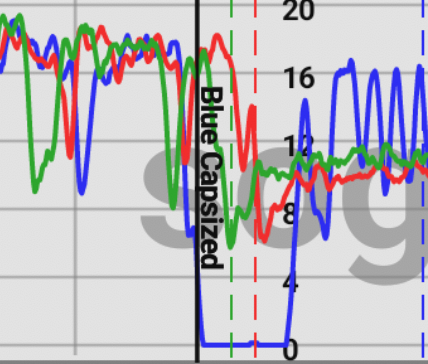
Add a text event by long-pressing the “Graph Screen” or “Path Screen” and selecting “New Event”. If you create it from the Graph Screen, the event time is taken from the pressed point on the graph. If you create it from the Path Screen, the event location is taken from the pressed position.
Selecting Location: You can move the event to any boat location by selecting the boat you want. The event will be placed where that boat was at the selected time.
Selecting Time: The event time can be set to the selection start, selection end, or a custom time.
Text Input: Under “Event Details”, tap “Edit” to enter the event text.
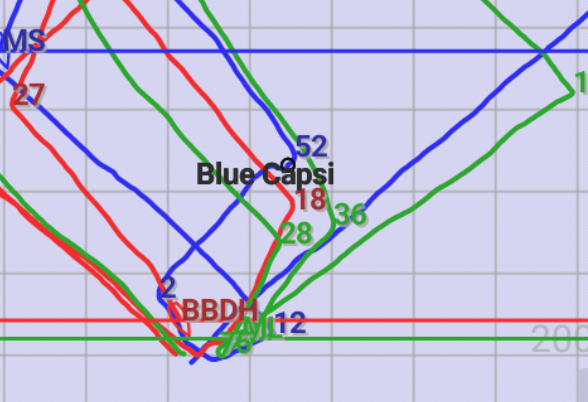
Created events are shown in the “Graph Screen” and “Path Screen”.
Events Dialog
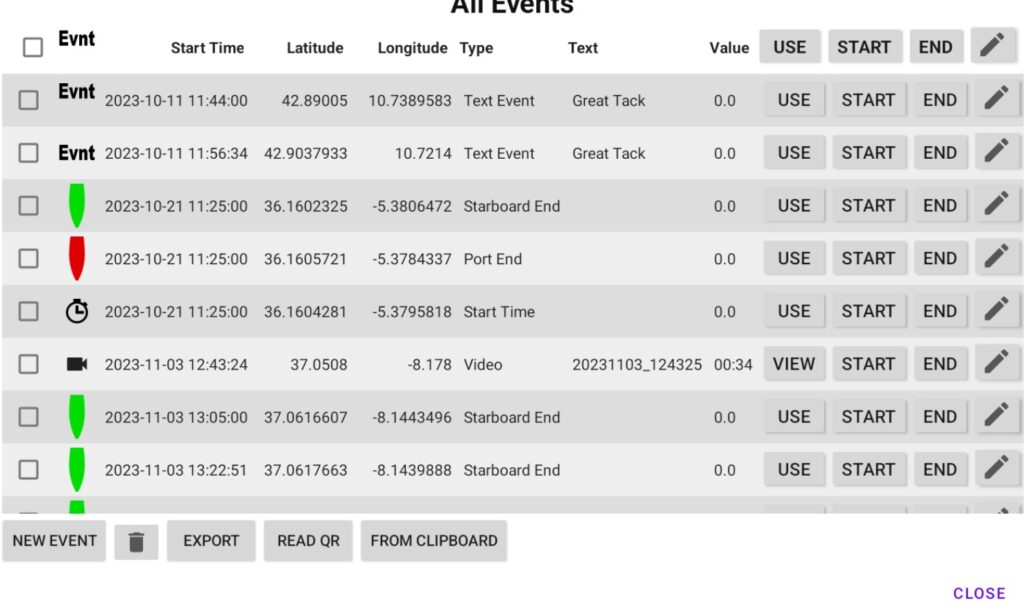
Open the Events dialog through “Menu Button > Events”.
“Export” exports all created events to a file, which can later be imported back into the app.
“Delete” removes the selected events.
“New” opens the “New Event” dialog.
For each event:
USE button uses the event (for start line, it sets it as current start line end or set the time). For media, button is named as View and it shows the media.
START moves the start slider to the start of the event.
END moves the end slider to the start of the event, which is useful when playing video.
Edit lets you edit the event details.
Maneuvers Screen
The Maneuvers Screen is an experimental feature. You can read more about it here: Maneuvers Screen.
Creating Subtitles For the Videos
The app can load video data and export a subtitle file that can be overlaid on the video. For the full process, follow the SailViewer Subtitles Guide.
Keyboard Shortcuts
If your device has a keyboard, you can use shortcuts to work faster. The full list is available here: Keyboard Shortcuts.
Example ways to use SailViewer
Cutting long daily logs
1. Open all the logs you want to cut together.
2. Move the sliders to the section you want and save it through …/Log/Save Logs.
3. New logs will be saved containing only the selected section.
4. Move the sliders to the next section and repeat for other segments.
5. The SOG graph helps identify when the races were taking place.
6. You can also tap the graph where you want to cut and choose Start Time or End Time to move the slider there.
Tuning run
– Adjust the wind manually, since the app cannot calculate wind from only one tack on its own.
– Set up all the values you need in the Data fields window.
– The Path Window shows the upwind distance between boats at the start and finish, which is useful for spotting an early advantage.
– Upwind distance values or average VMG show who performed better.
Cut Race
- Follow this guide to see how to cut the races
Training Alone
– A new value called DTS (distance to self) can be added. It measures distance to an imagined boat sailing at your average VMG for that leg, helping you spot where meters were lost or gained.
– When the value goes down, performance was below average and meters were lost. When it goes up, meters were gained.
Filters Example
You can isolate clean upwind sailing within a time range by selecting “only upwind leg” + “remove maneuvers” + “vmg >” with a fixed value slightly below the usual VMG for those conditions. This leaves only pure sailing and makes it quick to analyze just those periods.
Still in development
The app is under active development, and new features are added regularly. The main goal remains the same: keep it powerful, but simple and easy to use.
– Turn On The Experimental Features in Menu > Settings to be able to open the newly added features
– The app should work OK even on older tablets and different screen sizes and resolutions.
– Is not intended to be used on phones so everything there will be small. Still can do some of the above, even on the small screen
– Please send feedback or suggestions for the new features that you want
Ivan Bulaja, [email protected]