The Graphs window shows any selected value as one or more graphs at a time.
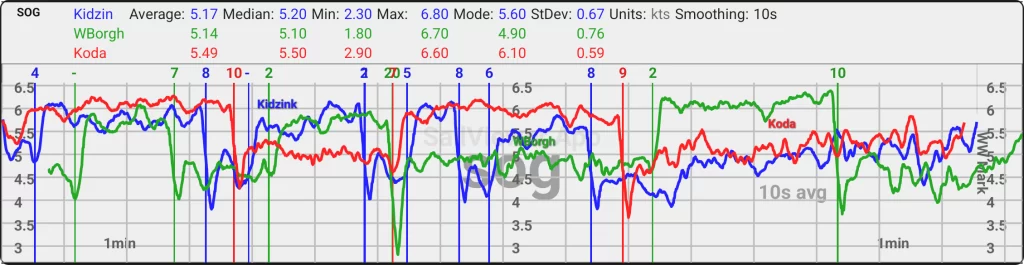
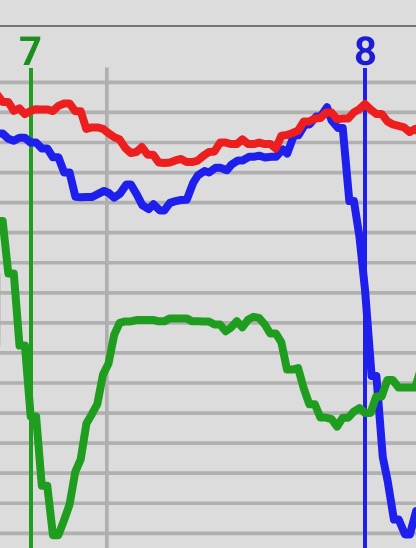
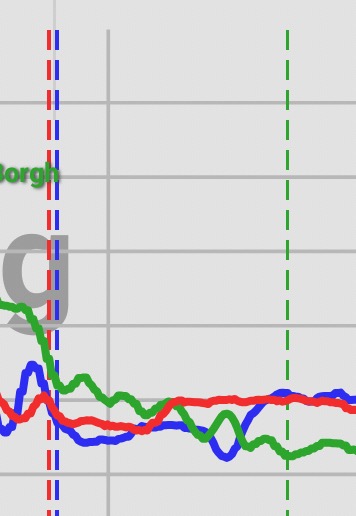
The Graphs window displays values for the selected time range. It also shows all maneuvers as vertical full lines and changing legs as dashed vertical lines. These lines can be switched on/off by using the “Lines” button or through the Options in popup menu
Above the graph, numerical value data is shown for the selected time range.

- Average
- Median – Median, value above and below which is the same amount of data. Spikes affect it less than average value.
- Min/Max – Minimum and Maximum value
- Mode – Value that appears most often
- StDev – Standard Deviation of the value
- Smoothing – Smoothing Average Time in seconds
Choosing the Values Presented
Choosing the single value
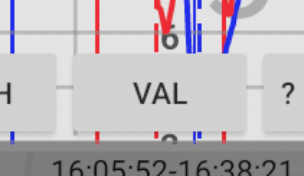
To choose the single value, press on the “VAL” button on the bottom middle of the graph. You will be presented with a dialog to replace the value with another one.
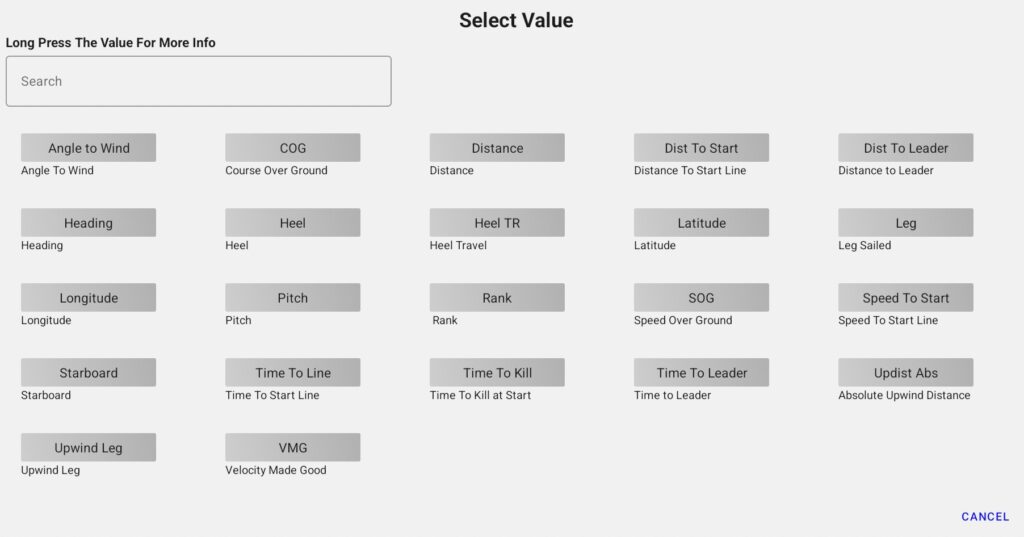
The single value choosing dialog is shown and you can choose which value to see in the graph. To get more info about any value, just long-press on its button.
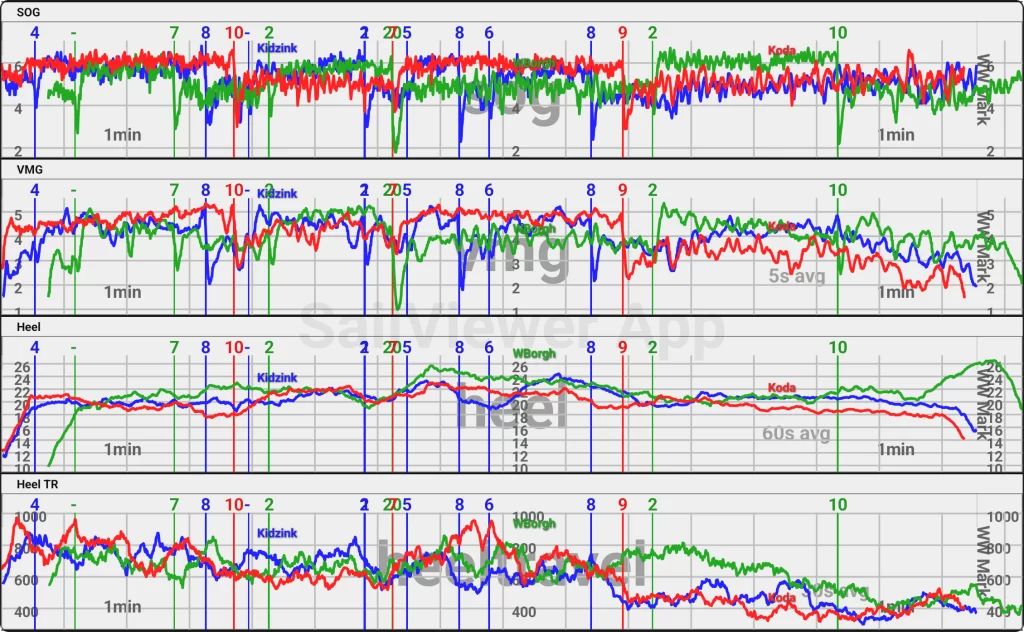
Choosing Multiple Values
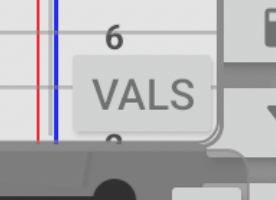
Multiple values are chosen by clicking on the “VALS” button on the bottom right of the graph screen.
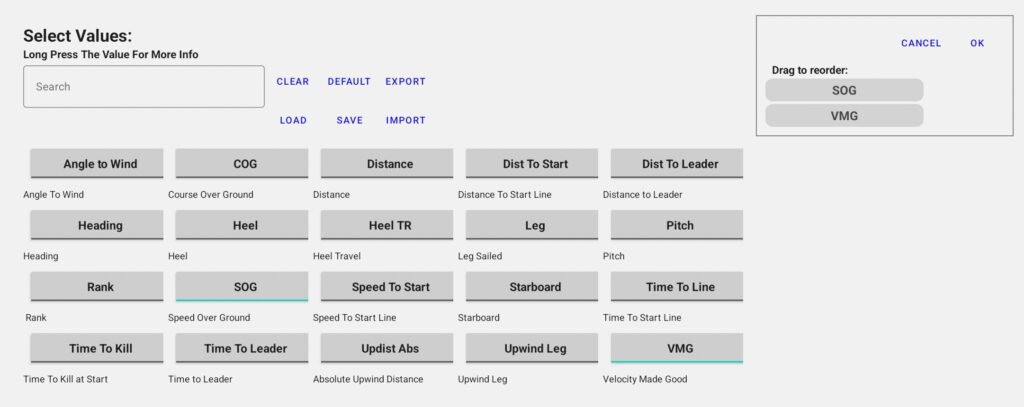
You can choose more graphs to show up one above the other. It is possible to reorder them in any way by dragging them up or down on the right side of the dialog. To get more info about any value, just long-press on its name.
Smoothing the graph lines
Press the “Smth” button to smoothen the values. Smoothing time can be 1,3,5,10,30,60 seconds and Auto mode that tries to smoothen depending on the duration of the selected time.
View Buttons
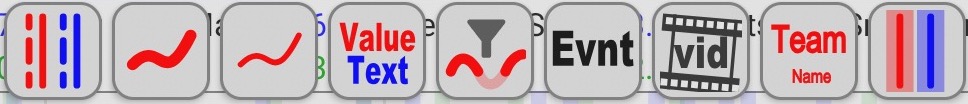
Show/hide maneuver and rounding lines
Thicker or thinner line
Show/hide value data text box
Hide filtered data completely or show it as a pale line
Show/hide events
Show/hide Videos
Change the size or hide team names
Display/hide maneuver timing boxes
The “?” button
Shows an info window about the value presented if the value has a description set.
The “X” button
The one at the mid-bottom of each graph hides just that single-value graph.
The one at the top right of the window closes all Graph windows.
Menu
To get the menu, just long-press anywhere on the graph.
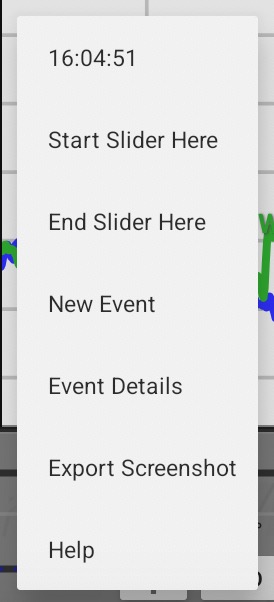
Start Slider Here/End Slider Here – moves the time slider to the touched point. Helps navigate to the wanted point without using the sliders.
New Event – opens the “New Event” dialog with the touched time as the timestamp for it.
Event Details– opens the “Events List” dialog with the focus on the nearest event to touched timestamp
Export Screenshot– exports the screenshot
Help – links to this guide webpage