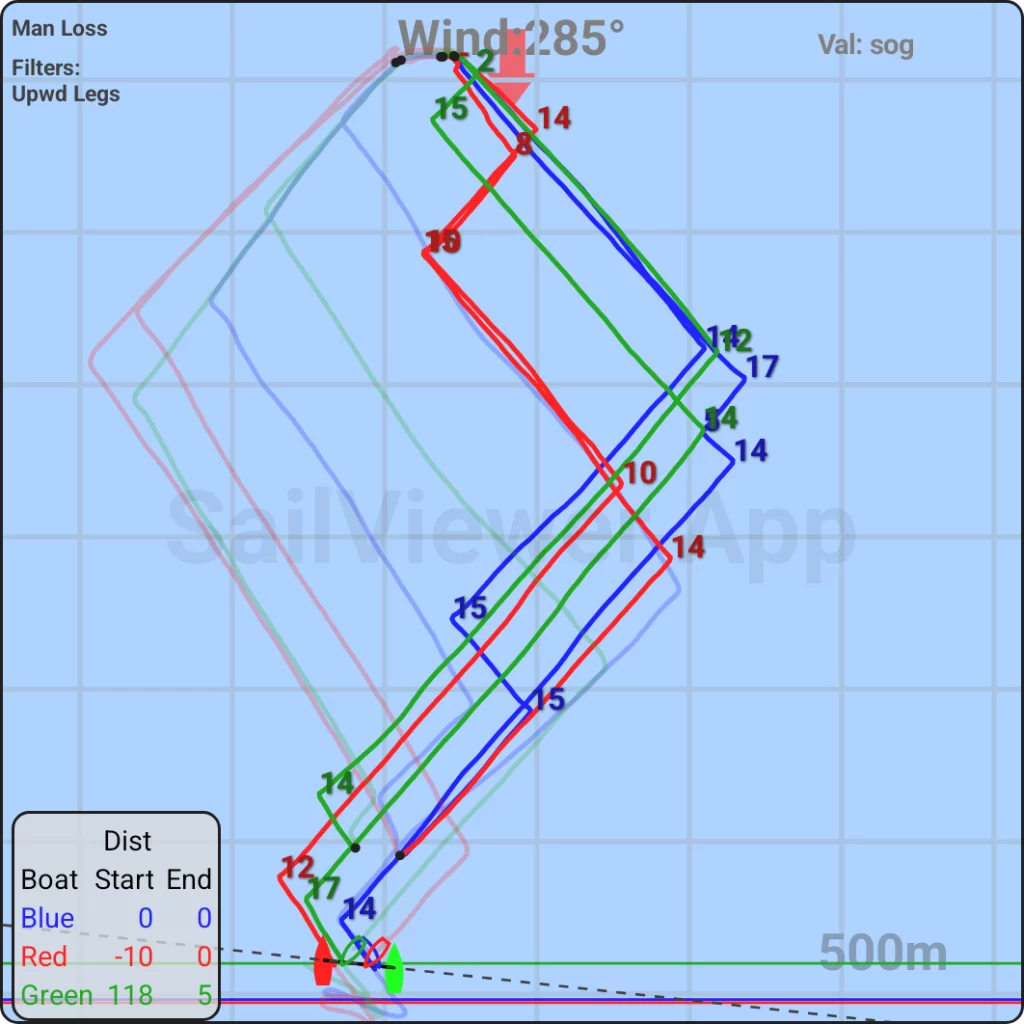
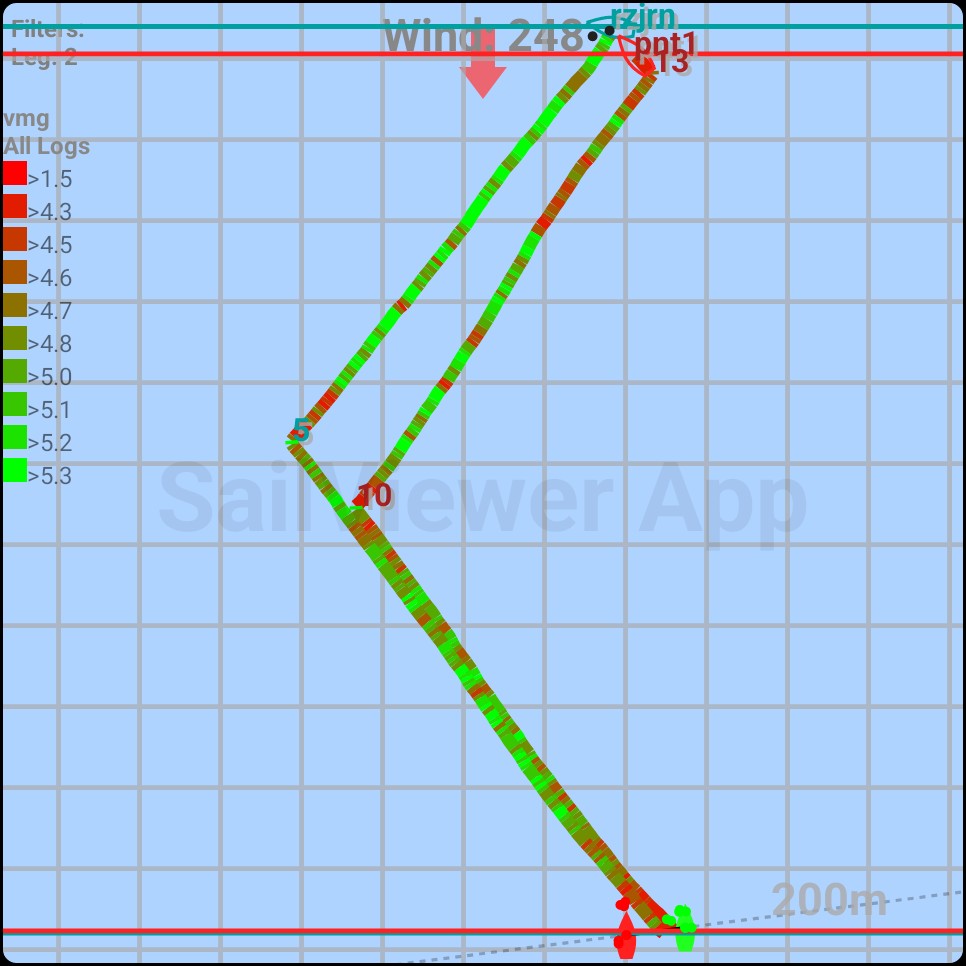
The Path Window shows the GPS tracks of all open logs for the selected time range.
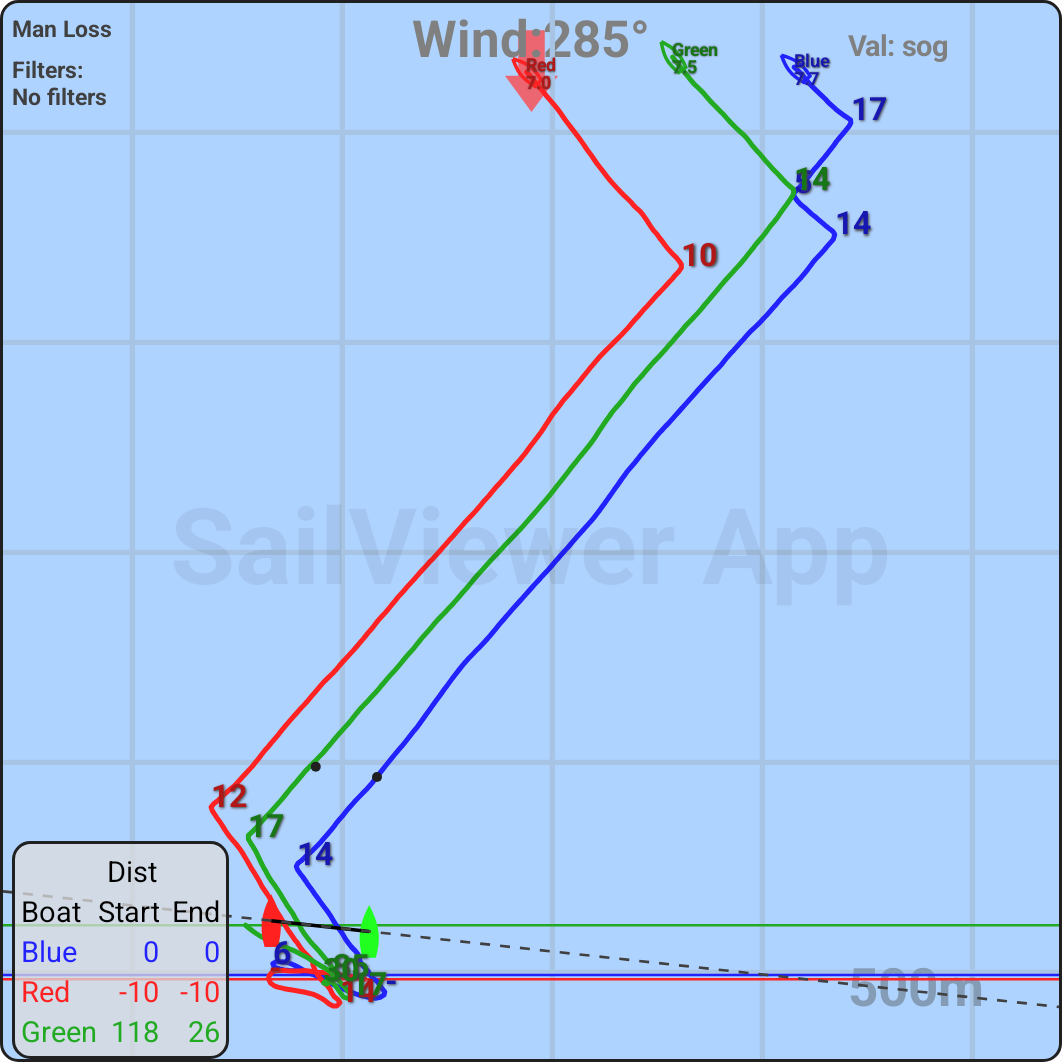
Wind always comes from the top of the screen, so the boat shown higher on the screen is farther upwind. The wind direction is shown next to the wind arrow. Once clicked anywhere on the “Path Window” the buttons show up.
Maneuver Loss/Upwind Distance numbers

Button
The numbers next to paths show maneuver loss in meters of upwind distance or upwind distance sailed in the maneuver. Maneuver loss is calculated by comparing VMG during the tack with the reference VMG sailed before and after it. All these timings can be changed in the “Mans” screen by long-pressing the maneuver paths screen. Upwind distance sailed shows the meters of upwind distance sailed through the maneuver. This is especially helpful when there is not enough clean sailing before and after the maneuver to create a strong reference VMG.
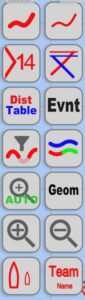
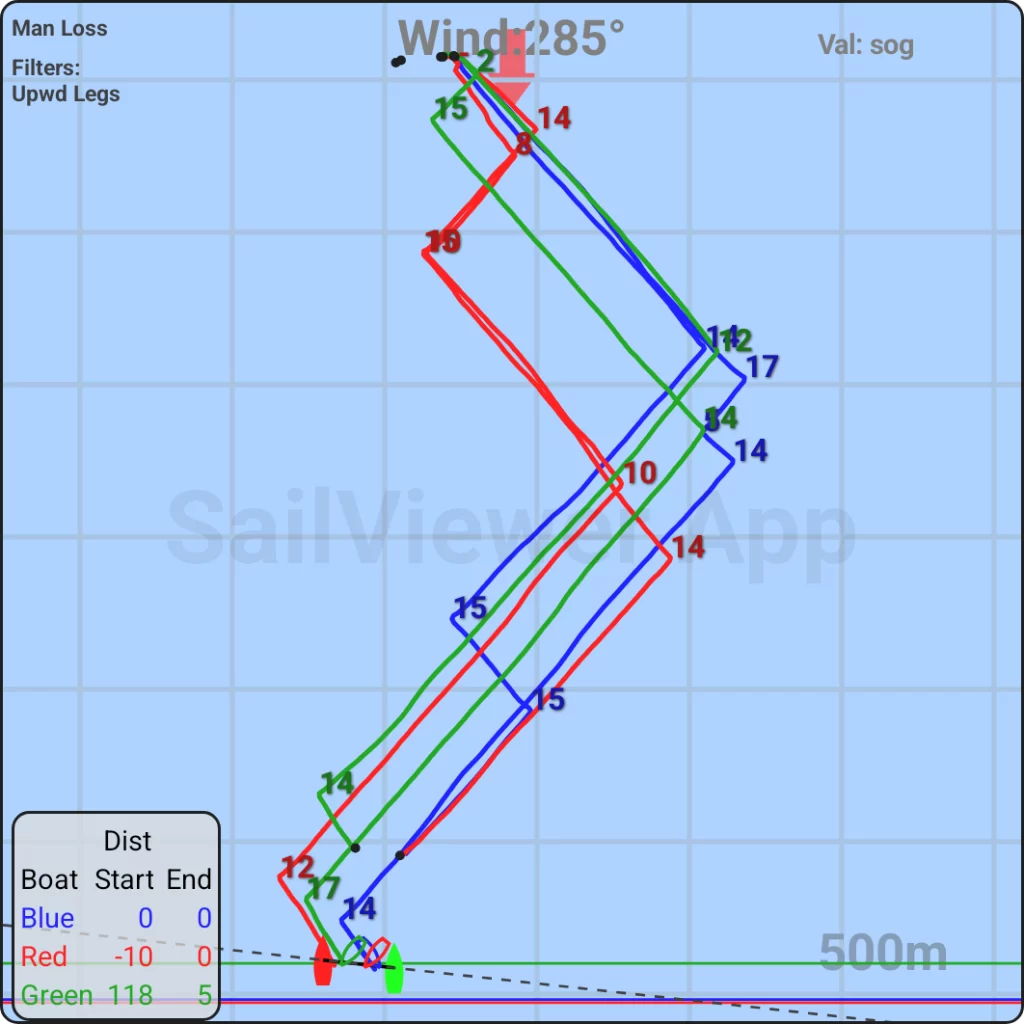
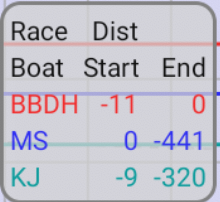
Distance Lines
The horizontal lines show the start and end positions of the boats for the selected time. By using this button it is possible to turn on only start, end or both lines.
Path Thickness
The thickness of the path can also be changed through the Path Thickness buttons or through the settings button.
Filter View Style
Once the filter is applied to the log, the “FIlter Style” button can be used to change the look of the filtered paths.
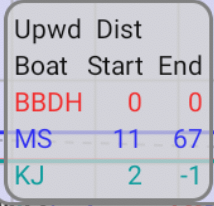
Distance Table
The “Distance Table” shows the upwind distance between the boats at the selection start and selection end. It can also show the distance in the race, accounting for the different legs. The two modes are swapped by clicking on the table top left corner. The table can be hidden using the “Hide Table” button. When in Upwind Distance mode, by clicking on a single boat number, that boat becomes the reference boat for measuring the distances.
Value Coloring
Paths of boats can be colored with regards to any value chosen. Track will be colored between bright red towards bright green. Each color represents 10% of time sailed, starting from the lowest value number towards the highest. By selecting the VMG, the overall performance is shown. To change the value, long-press the path screen and select “Value To Color” menu item. Value coloring gets switched on by using the Value Color button. It can be set that each log is colored individually and also that it colors the value based on all the logs.
Leg Geometry
Leg geometry button shows the geometry data about the leg. In order to see it, leg has to be selected or only one leg should be in between the time sliders.
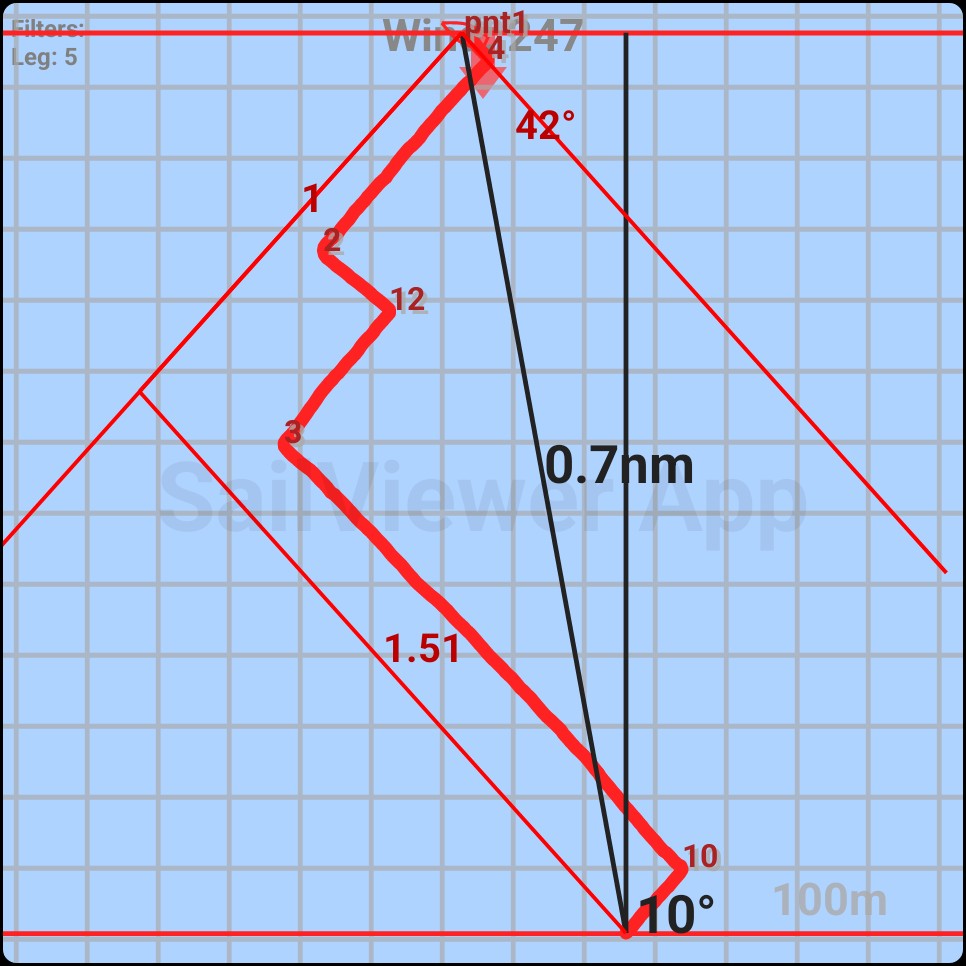
Geometry shows:
- Leg Length in nautical miles
- leg angle offset compared to the wind direction
- laylines based on the boat’s upwind angle
- ratio between the distance needed to be sailed on port and starboard
Zoom Controls
Path Screen can be zoomed in and out and the path can be moved around by dragging it.
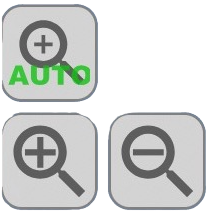
Zoom In/Out buttons zoom the path. You can also zoom in by double-clicking anywhere on the screen or by pinching it.
Auto Zoom Button makes the zoom adjustment to fit all the paths selected.
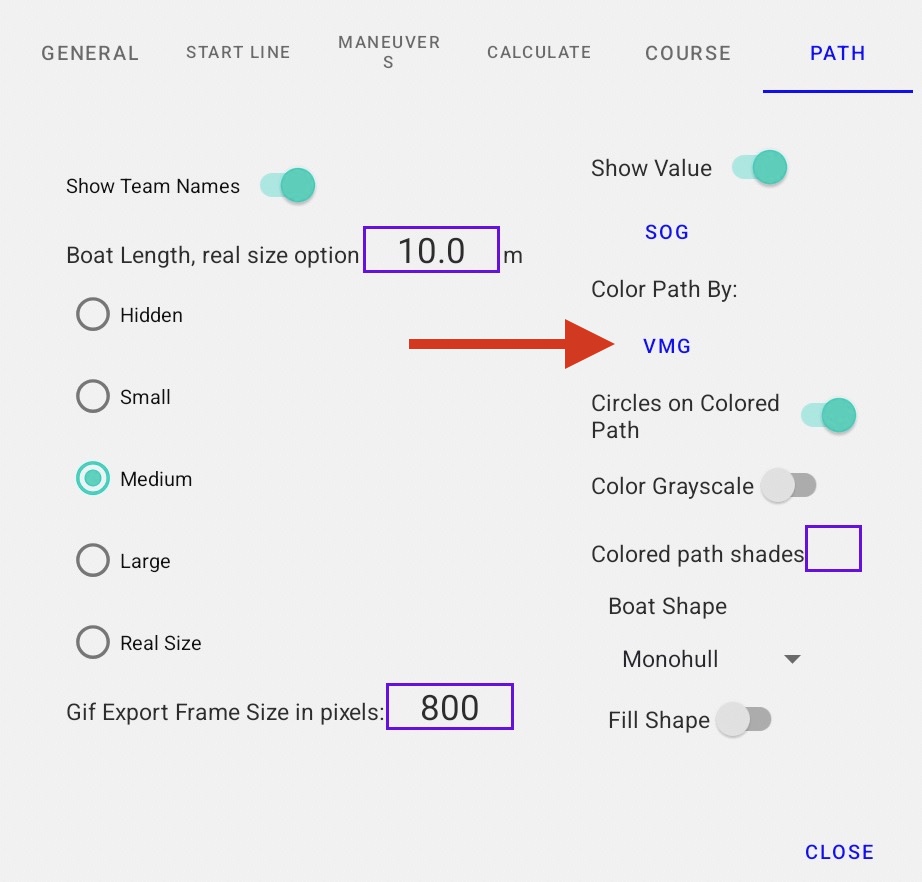
Path Options
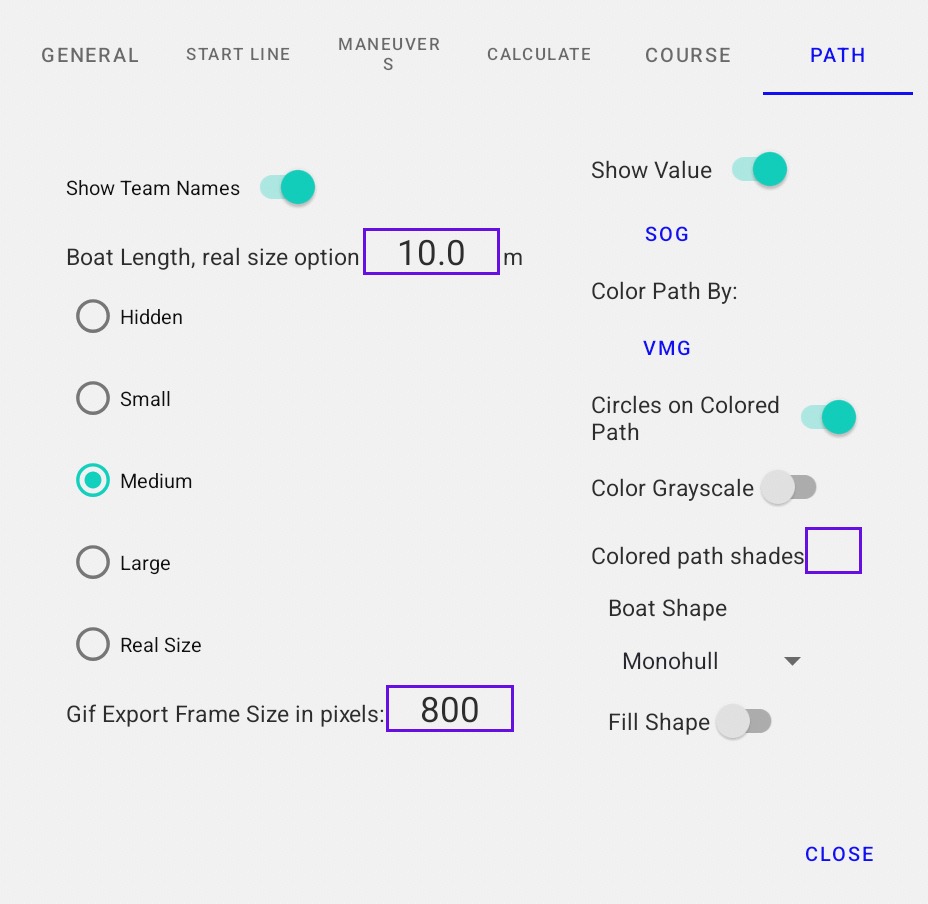
Show Team Names -> Hides or shows the team names
Boat Size -> circle through different boat shape sizes. If real size option is used, then boats will be drawn at the boat length set in the setting above.
GIF export size -> size of GIF animation that gets created. Higher one creates larger files.
Show Value -> Current value number is shown next to the boat. You can pick any value.
Color Path By -> When in colored path mode, path is colored by this value
Circles on colored path -> Draws circles under the path to identify the boat color easier
Color Grayscale -> Changes coloring between black and white instead red and green
Colored Path Shades -> Decides how many different shades of Green/Red are used
Boat Shape -> Selects the shape of the boat and if it is filled or empty